HUMA Committee Report
If you have any questions or comments regarding the accessibility of this publication, please contact us at accessible@parl.gc.ca.
|
Census 2016 data was released by Statistics Canada over the course of the Committee’s study. Data relating to age and sex was released in the spring of 2017. Additional data relating to income, housing, immigration, and the Indigenous population was released during the fall of 2017.[48] This chapter provides an overview of this important Census 2016 data. A. The population 65 and older living in low incomeThe 2016 Census presents incomes in Canada as measured in 2015. While the incomes of seniors have increased over the past 10 years, as a group, the rate of individuals aged 65 and older in low income rose from 12% in 2005 to 14.5% by 2015 (see Figure 2.1 for details).[49] While the increase was particularly strong for senior men, overall, senior women were still more likely to be in low-income situations in 2015.[50] Figure 2.1: Incidence of Low Income by Single Year of Age: 2005 and 2015
Source: Statistics Canada, Census 2016, Household income in Canada: Key results from the 2016 Census, 9 September 2017, Infographic 2. 1. Vulnerable sub-populationsAs identified by witnesses, another important point with respect to low income is that some groups are more at risk of being in low-income situations than others. They include older women (over 85 years) who are living alone,[51] Indigenous seniors,[52] and recent immigrants who are seniors.[53] "[S]ome groups are more at risk of being in the low-income situations than others. They include older women (over 85 years) who are living alone, Indigenous seniors, and recent immigrants." Figure 2.2 illustrates the numbers and percentages of seniors living in low income in 2015 by age group and sex. While senior women between 65 and 74 years of age were somewhat more likely to be living in low-income compared with men of the same age, women over the age of 75 were far more likely to be living in low-income (yellow diamonds). Specifically, 20% of women over the age of 75 were living in low-income situations in 2015 compared with 12% of men.
Figure 2.2: Numbers and Percentages of Seniors with Low-income by Age Group and Sex: 2015
Note: Prevalence of Low Income is determined using the Low income measure, after tax (LIM-AT). Source: Figure prepared by the authors using data obtained from Statistics Canada 2016 Census Data Tables, Low Income Indicators, Catalogue number: 98-400-X2016126, 13 September 2017. The incidence of First Nations, Inuit and Métis seniors living in low income is greater than the non‑Indigenous population. The 2016 Census recorded over 1.6 million First Nations, Inuit and Métis people in Canada, which represents about 4.9% of the total population. The average age of the First Nations, Inuit, and Métis population is 32.1 years, almost a decade younger than the average for the non‑Indigenous[54] population.[55] In contrast, the population of Indigenous seniors is relatively small, numbering 121,670 (of whom 53.6% are women and 46.4% are men).[56] Figure 2.3 illustrates that the highest incidence of low income among senior Indigenous people is women who identify as First Nations (27.2%) and women who claim multiple Indigenous identities (27%). This is over twice the incidence of low‑income of non‑Indigenous senior men (12%) and significantly higher than non‑Indigenous senior women (16.7%). Figure 2.3: Incidence of First Nations, Inuit, Métis Seniors in Low Income by Identity and Sex: 2015
Note: Prevalence of low income is determined using the Low‑income measure, after tax (LIM-AT). Source: Figure prepared by the authors using data obtained from Statistics Canada 2016 Census Data Tables: Aboriginal Identity, Catalogue number: 98-400-X2016173, 25 October 2017. Similarly, low income is greater among seniors born outside Canada. According to the 2016 Census,[57] approximately 7.5 million people, of whom about 1.68 million are 65 years and over, were born outside Canada. The likelihood of having low income is higher for immigrant senior women than immigrant senior men. There are important differences in the incidence of low income among immigrant seniors depending upon when they immigrated.[58] Figure 2.4 illustrates that the highest incidence of low income for immigrant seniors is for those who arrived in Canada between 1991 and 2000. Figure 2.4: Incidence of Seniors in Low-Income by Period of Immigration and Sex: 2015
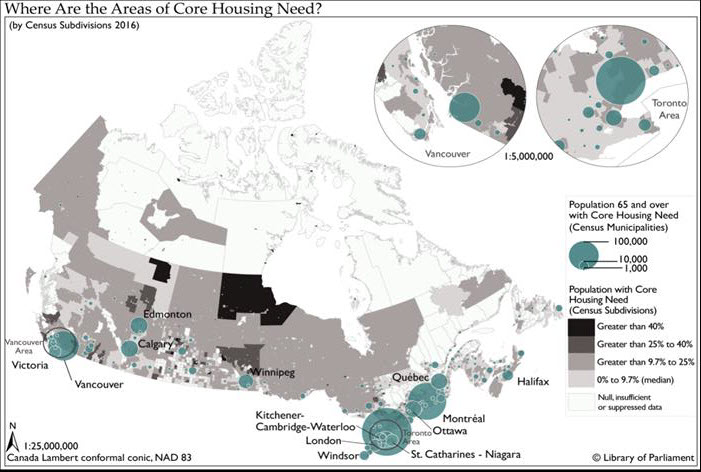
Source: Figure prepared by the authors using data from Statistics Canada 2016 Census Data Tables: Immigration and ethno-cultural diversity, Catalogue number: 98-400-X2016206. 25 October 2017. B. Core housing needThe recent census released describes key housing indicators, such as the rate of home-ownership and the percentage of individuals in “core housing need,” that is individuals who live in dwellings that are unsuitable, inadequate or unaffordable and whose income levels are such that they cannot afford alternative housing in their community. Core housing need is correlated with where you live in Canada, housing tenure, living arrangements and age.[59] "Over 1.3 million seniors, or roughly 25% of the senior population, have core housing need." Over 1.3 million seniors, or roughly 25% of the senior population, have core housing need. Affordability is the dominant factor that contributes to core housing need. About 78% of seniors who are in core housing need are facing affordability challenges, spending over 30% of their before tax household income on shelter.[60] Figure 2.6 illustrates the geographic distribution of people aged 65 and over in core housing need in census metropolitan areas across Canada.[61] 1. Seniors who are renters or who have mortgages are more vulnerable“Housing tenure” is the term used by Statistics Canada to refer to whether you rent or own your home. In 2016, the homeownership rate was highest at 76.3% for 55 to 64-year olds, and was slightly lower at 74.6% for the population aged 65 and over. The data indicates that seniors were more likely to own their homes in 2016 than they were a decade earlier. The homeownership rate among the population aged 65 and over was 72.2% in 2006.[62] Figure 2.5 illustrates the proportions of the population aged 65 and over who own their homes and those who rent. Figure 2.5: Canadian Seniors According to Housing Tenure: 2016
Source: Figure prepared by the author using data obtained from Statistics Canada 2016 Census Data Tables: Housing Table Catalogue number: 98-400-X2016234, 25 October 2017. Figure 2.6: Core Housing Need
Figure 2.7 illustrates the percentage (yellow diamonds) and numbers of seniors (green bars) in core housing need according to housing tenure. The data indicates that while there are overall fewer seniors who are renters, they are more likely to experience core housing need. Specifically, there are over 120,000 senior renters receiving some form of housing subsidy who have core housing need. This represents close to 56% of the population of senior renters in subsidized housing. About 39% of senior homeowners with mortgages are in core housing need. In contrast, only about 9% of mortgage-free homeowners[63] experience core housing need. Figure 2.7: Numbers and Percentages of Seniors in Core Housing Need by Housing Tenure: 2016
Source: Figure prepared by the author using data obtained from Statistics Canada 2016 Census Data Tables: Housing Table, Catalogue number: 98-400-X2016234, 25 October 2017. 2. There are important geographic and regional variationsExperiencing core housing need also seems to be correlated with where you live. At the provincial/territorial level, people aged 65 and over in Nunavut and the Northwest Territories are more likely to be living in housing that is inadequate, unsuitable or unaffordable. In Nunavut, 48.3% of seniors have core housing need, whereas in the Northwest Territories this figure is 33.4%. In addition, over 27% of seniors in Ontario experience core housing need, which is higher than the national average of 24.9%.[64] With respect to census metropolitan areas (CMA) and census agglomerations (CA), the Toronto CMA has the highest incidence of seniors in core housing need at about 34%. Toronto is followed by the Hawkesbury Ont./Que. CA, with 33% of seniors in core housing need; the Timmins, Ont. CA, with 31% of seniors in core housing need; and then the Vancouver CMA and the Prince Rupert, BC CA, with over 29% of seniors in core housing need. Note that in some instances the levels of core housing need can be different for the senior population (e.g. Hawkesbury, Timmins and Prince Rupert) than for the non-senior population.[65] Regional variability is consistent with Census data on dwelling values as estimated by occupying homeowners. These estimates indicate important variations among Canada’s CMAs. In May 2016, Vancouver homeowners reported, on average, the estimated value of their dwellings to be $1,005,920, compared with $734,924 in Toronto and $366,974 in Montreal. Canada wide, the average estimated value in 2016 was $443,058, compared to $368,899 (in constant dollars) in 2011.[66] 3. Older seniors living alone are the most vulnerableFinally, core housing need seems to increase with living alone, which in turn is associated with age. Figure 2.8 illustrates the percentages (yellow diamonds) and numbers of seniors (green bars) in core housing need according to living arrangements. Close to 600,000 seniors living alone, representing about 43% of this sub-population, have core housing need. The number of seniors who are married or in common-law relationship reporting core housing need numbered about 540,490, representing only 16% of the married/common‑law sub-population. While fewer seniors report living with others (son or daughter, other relatives or non-relatives) but not in a couple, they are more likely to be in core housing need.[67] As seniors age, the likelihood of living alone increases. In 2016, about 29% of seniors between 75 and 84 years of age lived alone. In contrast, the percentage of seniors 85 years and over living alone was over 43%.[68] Moreover, the incidence of core housing need for the sub‑population 85 years and over was 31.7%. The incidence of core housing need for seniors 85 years and over and living alone exceeded 61%.[69] Witness suggestions provided alternatives to living alone; these are described more fully in the chapter on social inclusion. Figure 2.8: Senior Core Housing Needs by Living Arrangements: 2016
Source: Figure prepared by the authors using data obtained from Statistics Canada 2016 Census Data Tables: Housing Table Catalogue number: 98-400-X2016234, 25 October 2017. [48] Statistics Canada, 2016 Census topic: Age and sex, 3 May 2017, 2016 Census topic: Housing, 25 October 2017, 2016 Census topic: Income, 13 September 2017, 2016 Census topic: Immigration and ethnocultural diversity, 25 October 2017, 2016 Census topic: Aboriginal peoples, 25 October 2017. [49] Statistics Canada, Household income in Canada: Key results from the 2016 Census, 13 September 2017. [50] Ibid. [51] HUMA, Evidence, 1st Session, 42nd Parliament, 17 October 2017 1605 (Mr. Sébastien Larochelle-Côté, Managing Editor, Education, Labour and Income Statistics Branch, Statistics Canada). See Appendix D, for a map that illustrates where in Canada men and women aged 65 and over live. [52] Written submission from National Association of Friendship Centres, 10 November 2017, p. 3. [54] Statistics Canada refers to First Nations, Inuit and Métis people collectively as Aboriginal in the 2016 Census. Throughout the text of this report the term Indigenous is used to refer to First Nations, Inuit and Métis collectively. In charts using Statistics Canada data, the term Aboriginal is used. [55] Statistics Canada, The Aboriginal population in Canada, 2016 Census of Population, 25 October 2017. [56] Statistics Canada 2016 Census Data Tables: Aboriginal Identity, Catalogue number: 98-400-X2016173, 25 October 2017. [57] Statistics Canada, Immigrant population in Canada, 2016 Census of Population, 25 October 2017. [58] Statistics Canada, 2016 Census topic: Immigration and ethno-cultural diversity, 25 October 2017. [59] Statistics Canada, in collaboration with the Canada Mortgage and Housing Corporation (CMHC), has produced the CMHC’s core housing need indicator for the 2016 Census. A household is said to be in ‘core housing need’ if its housing falls below at least one of the adequacy, affordability or suitability standards and the household would have to spend 30% or more of its total before-tax income to pay the median rent of alternative local housing that is acceptable (meets all three housing standards). Adequate housing is reported by their residents as not requiring any major repairs. Suitable housing has enough bedrooms for the size and composition of resident households according to National Occupancy Standard requirements. Core housing need is assessed only for private, non-farm, non-reserve and owner- or renter-households. See also: Statistics Canada, Core housing need, 2016 Census, 15 November 2017. [60] Statistics Canada 2016 Census Data Tables: Housing Table, Catalogue number: 98-400-X2016234, 25 October 2017. [61] Statistics Canada, Core housing need, 2016 Census, 15 November 2017. The 2016 Census uses the term housing 'Tenure' to refer to whether the household owns or rents their private dwelling. [62] Statistics Canada, Core housing need, 2016 Census, 15 November 2017. [63] In calculating shelter costs for owners, CMHC includes “mortgage payments (principal and interest), property taxes, condominium fees, and payments for electricity, fuel, water and other municipal services.” For more information, see CMHC, “Housing Affordability and Need,” Canadian Housing Observer 2014, p. 1-17. [64] Statistics Canada, 2016 Census Data Tables: Housing Table, Catalogue number: 98-400-X2016234, 25 October 2017. See Appendix D, for a map that illustrates municipalities with high prevalence of core housing need among seniors. [65] Ibid. [66] Statistics Canada, Housing in Canada: Key results from the 2016 Census, 25 October 2017. [67] Statistics Canada, 2016 Census Data Tables: Housing – 4 Catalogue number: 98-400-X2016234, 25 October 2017. [68] Ibid. [69] Ibid. |