INDU Committee Report
If you have any questions or comments regarding the accessibility of this publication, please contact us at accessible@parl.gc.ca.
CHAPTER 2 -- FOREIGN OWNERSHIP RESTRICTION -- THE ECONOMIC DIMENSIONIt would perhaps be unnecessary to examine the economic dimension of removing foreign ownership restrictions if the current Canadian telecommunications industry was considered a world leader in terms of consumer price, level of services, and mobile phone penetration. Commentators on both sides of the foreign ownership issue have, however, described the Canadian telecommunications sector—in particular the wireless segment—as an industry that is “complacent”[33] and one that enjoys higher than “normal” profit margins. This chapter first examines some of the market features of Canada’s telecommunications industry that were brought up by witnesses during Committee meetings to justify removal of foreign ownership restrictions. It then examines the arguments put forth by some witnesses as to the how the elimination of foreign ownership restrictions could improve these market characteristics. A. Some Market Features of Canada’s Telecommunications Industryi) Access and UseBased on a study published in 2009 by the International Telecommunications Union (ITU),[34] Canada ranked 19th of 154 countries in terms of information and communication technologies (ICT) development (based on 2007 data). To measure this development, the ITU developed an index (the “ICT Development Index”) that includes the following indicators:
As recently as 2002, Canada ranked 9th overall in ICT development, which means that between 2002 and 2007, Canada slipped ten positions in the rankings. Of the top 40 countries in the ICT development index in 2007, Canada experienced the worst decline in status since 2002. Other countries that also experienced a significant drop were China and Belgium, which both fell nine places. It is important to note that Canada’s ICT development index did improve from 2002 to 2007; however, its rate of increase was much lower than that of other countries. The United States ranked two positions ahead of Canada, taking the 17th place while Australia, often considered Canada’s “sister” country in terms of population density and geography, ranked five positions ahead. Regarding the “Access” sub-components of the ICT index, Canada ranked in 15th place, ahead of Australia by four positions and ahead of the United States by six positions. Canada was also in 15th place for “Access” in 2002. With respect to the “ICT Use” sub-component of the index, Canada ranked 21st overall, faring worse than Australia by nine positions and worse than the United States by five positions. Canada was in fourth place with respect to “ICT Use” in 2002. This sub-component of the index is therefore largely responsible for the lacklustre progression of Canada between 2002 and 2007 regarding ICT development. Table 1 summarises the ITU study results for five countries. Although Canada generally fared better in 2002 than the other countries presented in Table 1 (with the exception of Sweden), it generally performed worse than the same countries in 2007. Table 1—Positions of Selected Countries in the ICT Development Study in 2002 and 2007
Source: Measuring the Information Society, The ICT Development Index, International Telecommunication Union, 2009.
Table 2—Cellular Mobile Subscribers per 100 inhabitants, 2002 and 2007
Source: OECD Communications Outlook 2009. As mentioned during the Committee’s hearings, although Canada is considered a laggard in terms of mobile cellular penetration, it is considered a leader in terms of broadband subscribers. Table 3 shows that Canada generally performed better than its peer group on this metric. This being said, Canada’s lead has narrowed considerably between 2002 and 2007. Many countries are now within striking distance of Canada’s leadership position in broadband penetration, as shown in Table 3. Table 3—Total Broadband Subscribers per 100 inhabitants, 2002 and 2007
Source: OECD Communications Outlook 2009. Moreover, a February 2010 study from the Berkman Centre for Internet and Society at Harvard University ranked Canada 16th in terms of broadband penetration out of 30 OECD countries and 17th in terms of speed. The Berkman study describes Canada’s performance in terms of broadband penetration as follows:[36] The CRTC indeed opens its August 2009 Communications Monitoring Report with a self-congratulatory reference to the fact that Canada has the highest level of penetration of all the G7 countries. While factually true, an alternative view of Canada’s performance might look at several factors. In December of 2003, Canada had the second highest level of broadband penetration per 100, second only to South Korea. By September of 2008, it ranked 10th by the same measure. Its numbers on speed and price are worse. The Committee notes that latest data both for the ICT index and the OECD study are for 2007, and that much could have changed in the intervening period since three years is almost an eternity in the fast changing telecommunications industry. Nevertheless, Canada’s lacklustre progression between 2002 and 2007 and its stubbornly low level of mobile cellular penetration are worrisome. ii) Consumer Price Comparisons
A brief overview of international price comparisons would seem to substantiate this claim. Both the ITU and OECD studies provide price comparisons that arrive at starkly different conclusions for some indicators, particularly with respect to the broadband segment. For example, among 29 countries in 2008[37], Canada was the country with the 2nd lowest broadband prices in the ITU study.[38] However, in the OECD study,[39] Canada ranked in 22nd, 23rd, and 28th place with respect to price for low-speed, medium-speed and high-speed connections, respectively (first place in the rankings indicates the lowest prices).
In the mobile phone market segment, Canada has the 13th lowest prices among 29 OECD countries in the ITU study. According to the OECD study, Canada has the 20th lowest price in the mobile low-use market segment; the 26th lowest prices in mobile medium-use; and the 18th lowest prices in the mobile high-use segment. Table 4 summarises results for Canada and other countries for the mobile phone market both for the ITU and OECD studies (using medium use results in the case of the OECD study). Table 4—Position of Selected Countries in terms of Mobile Cellular Prices (first place indicates the lowest price)
Source: Measuring the Information Society, The ICT Development Index, International Telecommunication Union, 2009 and OECD Communications Outlook 2009. The 2010 Berkman study (referenced earlier) ranked Canada as the country with the 19th lowest prices out of 30 OECD countries in terms of current generation broadband speed. The Berkman study further ranked Canada 18th out of 19 countries on price for next generation speeds, and provides the following statement on broadband pricing:[40] Our company-level pricing study for the highest-speed offers in the countries we observe here locates all of the Canadian companies but one in the cluster with the slowest speeds and highest prices. Given that contradictions would seem to exist in terms of retail price comparisons in some market segments, the results should be interpreted with caution. This message was relayed to the Committee by several witnesses. Nevertheless, there was a general consensus that mobile cellular prices in Canada are generally higher than in other countries. The Committee notes that results from the two studies noted in this section do not contradict this assertion. iii) Level of ConcentrationBy all accounts, the level of concentration in the Canadian telecommunications industry is high. This is particularly the case in the mobile network segment where three providers (Rogers, Bell and Telus) had a 95.7% market share in 2007,[41] based on data from the OECD. Canada’s situation in this regard is not unique. Table 5 presents the level of concentration of the three largest mobile network operators in various countries. High levels of concentration for mobile networks are the norm, rather than the exception. Drawing a link between Canada’s relatively poor performance in terms of cellular mobile subscribers and the level of concentration in the industry should be made cautiously given that many countries that have similar levels of concentration in the mobile network operators have high cellular mobile penetration (e.g., Germany, Finland and New Zealand). Table 5—Market Share of the Three Largest Mobile Network Operators in Selected Countries, 2007 (percentage market share based on the number of subscribers)
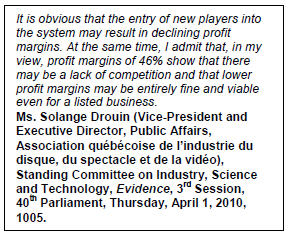
Source: OECD Communications Outlook 2009. iv) Operating Margins in Wireless and Broadcasting DistributionThe return on equity and the profit margins of the three major telecommunications common carriers were metrics that were also mentioned by several witnesses during the Committee’s hearings. Witnesses on both sides of the foreign ownership debate made reference to the strong operating margins in the wireless market segment in particular. Figure 2 presents data on the return on equity for Bell, Rogers and Telus (hereinafter referred to as the “large incumbents”) over the last ten years. Figure 2—Return on Equity for Canada’s Largest Telecommunications Common Carriers
Source: Data-Thomson Reuters, via MSN Money, http://money.ca.msn.com/, Graphic-
Parliamentary Information and Research Service, Library of Parliament. The large incumbents are holding companies with multiple business segments. The data in Figure 2 are therefore aggregate data representing an average across all business segments. Testimony presented during the Committee’s hearings focused heavily on profit margins in the wireless industry, and to some extent, in the broadcasting distribution industry. Specific data for the wireless business segment of the large incumbents are therefore also presented here. Operating margins[42] for the wireless segment are shown in Table 6. Capital expenditure intensity, which is capital expenditures divided by operating revenue, is also presented for each firm. Table 6—Operating Margins and Capital Expenditure Intensity of Canada’s Largest Wireless Operators
Source: 2009 Annual Reports (BCE, Rogers, TELUS). Operating margin is earnings before interest, taxes, depreciation and amortization as a percentage of operating revenue. Capital expenditure intensity is capital expenditure as a percentage of operating revenue. Operating margin net of capital expenditure intensity is operating minus capital expenditure intensity. For Rogers, numbers on property, plant and equipment additions were used to estimate capital expenditures. As shown in Table 5, wireless is a high margin business and this
could help explain the interest of new players in entering the wireless market
segment in Canada. Even after subtracting capital expenditures, operating
margins remain substantial. Importantly, the wireless market in Canada would appear
to be a “stable oligopoly” since
Broadcasting distribution was also mentioned during the Committee’s hearings as being a high profit margin business. The CRTC publishes aggregate data on operating margins in broadcasting distribution. These data are presented in Table 7. Table 7—Operating Margins in Broadcasting Distribution (all services) in Canada
Source: CRTC, http://www.crtc.gc.ca/eng/publications/reports/BrAnalysis/dist2009/bdu1.htm. Financial data for the wireless and broadcasting distribution industries suggest that large incumbents in these business segments enjoy a stream of cash flow that provides them with an important source of capital to fund new investments. This “free” cash flow in turn lowers their risk profile, which decreases their cost of capital. This element is examined in more detail in the next section in the context of foreign ownership restrictions. B. Addressing some of the Market Features: Macro-Economic Arguments in Favour of the Removal of Foreign Ownership Restrictions
C. Addressing some of the Market Features: Micro-Economic Arguments in Favour of the Removal of Foreign Ownership RestrictionsA strong consensus existed among all telecommunications common carriers (large incumbents, small incumbents and new entrants) heard by the Committee that the main effect, at the firm level, of removing foreign ownership restrictions would be to lower the cost of capital. This aspect is examined in the following sections. i) Name of the Game: The Cost of CapitalSince the study by the Committee was triggered by a specific case, namely the Globalive Wireless case (outlined in the introduction), arguments put forth by smaller players and new independent entrants in the wireless segment (hereinafter referred to as “SPNEs”) were also micro-economic in nature. Their comments focused on the need to remove restrictions on foreign ownership in order to lower the cost of capital for SPNEs. The importance of the cost of capital results from the very nature of the telecommunications industry: it is, and has always been a highly capital intensive business. Fixed costs are high and financial leverage typically very substantial. The significance of capital requirements was described by Alek Krstajic of Public Mobile as follows:[45] When you look at what you need the capital for, you need it to build your network, you need it to create your brand, establish your distribution, and then a cashflow trough. Remember, we are pre-revenue companies; we are starting from scratch. Think of us as an infant that needs to be nurtured. We’re not an 18-year-old yet. We’re really in a situation where there is no question, we’re going to require more capital. It’s not just access to capital, but on what terms and what the price of that capital is. [...] [C]apital is the lifeblood. Capital is what allows you to grow and play the game harder. By allowing foreign capital or a higher degree of foreign capital for Globalive, you’re allowing them to have six players on the ice, and you’re causing Public Mobile and everybody else in the game to have only five players on the ice. That’s just wrong. It should be noted that minimising the cost of capital is important for everybody, but is critically important for SPNEs in the wireless segment. The reason for this is that the large incumbents can count on the “free” cash flow that their incumbent position provides them. As explained in the previous section, the large incumbents could use this cash flow in a variety of ways including to fund expansion. The cash flow provided by their current asset base constitutes, for the large incumbents, self-generated capital and decreases their risk profile. This lower risk profile in turn lowers the risk premium demanded by capital markets. Therefore, the lower cost of capital for incumbent players in the wireless market could come via two intrinsically linked channels: 1) Lower levels of outside capital required because of self-generated capital; and 2) Lower risk premiums demanded by capital markets. New entrants are in no such situation. They typically cannot count on cash flow provided from their current asset base to finance part of their capital needs. Almost all their capital has to be sourced from capital markets. This makes the cost of capital a more critical factor for SPNEs than for large wireless incumbents. ii) The Link between Cost of Capital and Foreign Ownership Restrictions
We talk a lot about competition in wireless. It’s no different from a capital perspective: the bigger the pool and the fewer the restrictions structurally on how it can be invested, the more the cost will go down. And the more you can de-risk—the more successful you become, having revenues, having subscribers—the more attractive it becomes. For SPNEs, foreign ownership restrictions, because of the limit they impose on the potential sources of capital, result in a higher cost of capital. This could hamper the ability of SPNEs to pose a significant competitive threat to the large incumbents in the wireless market. Some witnesses suggested that in the absence of this competitive threat, the market features presented in previous sections may not improve. Not surprisingly, while SPNEs (MTS Allstream, Public Mobile, Globalive) forcefully argued in favour of removing foreign ownership restrictions when they appeared before the Committee, the positions of the large incumbents were more nuanced. Bell was in favour of lowering Canadian ownership requirements to 51% and maintaining the “control in fact” provision; Rogers had no formal position on the merits of changing Canada’s foreign ownership rules; Telus supported liberalisation providing that certain conditions are met. Spokespersons for broadcasting distributors (Shaw, Rogers) were also of the view that the main implication of current foreign ownership restrictions is to increase the cost of the capital. They pointed out, however, that access to capital does not represent a challenge for them at the present time. It has been argued that foreign ownership restrictions place quantitative limits on the ownership of voting shares, not on other forms of capital, and that, from this perspective, foreign ownership restrictions in Canada do not impose severe constraints on supplies of foreign capital. However, some proponents (Professor Morck, MTS Allstream) of the removal of foreign capital restrictions indicate that this statement does not take into account important factors:
[33] The word “complacent” was used by Richard Paradis (President, Groupe CIC) in his testimony in front of the Committee, Standing Committee on Industry, Science and Technology, Evidence, 3rd Session, 40th Parliament, March 30, 2010, 0915. [34] Measuring the Information Society- The ICT Development Index, 2009, International Telecommunications Union, 96 pages, http://www.itu.int/net/pressoffice/backgrounders/general/pdf/5.pdf. [35] OECD Communications Outlook 2009, http://www.oecd.org/document/44/0,3343,en_2649_34225_43435308_1_1_1_1,00.html. [36] Next Generation Connectivity: A Review of Broadband Internet Transitions and Policy from Around the World, Final Report, February 2010, Berkman Centre for Internet and Society at Harvard University p.168.,http://cyber.law.harvard.edu/sites/cyber.law.harvard.edu/files/Berkman_Center_Broadband_Final_Report_15Feb2010.pdf. [37] To make comparisons between the two studies, only countries surveyed by both studies were taken into account. [38] In terms of methodology, the ITU study eliminates the “fluctuating exchange rate” issue and the problem associated with level of income by presenting prices as a percentage of gross national income (GNI) per capita. [39] The OECD study compares prices in U.S. dollars using the purchasing power parity exchange rate. [40] Next Generation Connectivity: A Review of Broadband Internet Transitions and Policy from Around the World, Final Report, February 2010, Berkman Centre for Internet and Society at Harvard University p.168., http://cyber.law.harvard.edu/sites/cyber.law.harvard.edu/files/Berkman_Center_Broadband_Final_Report_15Feb2010.pdf. [41] Based on the number of subscribers. [42] It is important to note that “operating margin” is not the same as earnings. Operating margin are “Earnings before interest, taxes, depreciation and amortisation” or “EBITDA.” [43] According to the CRTC, Rogers had a 38% market share of wireless subscribers in 2008, while Bell and Telus each held 27%, CRTC Communications Monitoring Report 2009, p. 235, http://www.crtc.gc.ca/eng/publications/reports/policymonitoring/2009/2009MonitoringReportFinalEn.pdf. [44] Telecommunications Policy Panel, Afterword, Final Report 2006. [45] Standing Committee on Industry, Science and Technology, Evidence, 3rd Session, 40th Parliament, April 20, 2010. [46] Ibid. |
||||||||||||||||||||||||||||||||||||||||||||||||||||||||||||||||||||||||||||||||||||||||||||||||||||||||||||||||||||||||||||||||||||||||||||||||||||||||||||||||||||||||||||||||||||||||||||||||||||||||||||
 The
ITU study presents a broad measure of information and communication
technologies advancement for various countries. Discussions at the Committee’s
meeting, however, very much focused on the wireless segment. The Organisation
for Economic Cooperation and Development (OECD) publishes Communications
Outlook, wherein it presents data on cellular mobile penetration. According
to Communications Outlook 2009,
The
ITU study presents a broad measure of information and communication
technologies advancement for various countries. Discussions at the Committee’s
meeting, however, very much focused on the wireless segment. The Organisation
for Economic Cooperation and Development (OECD) publishes Communications
Outlook, wherein it presents data on cellular mobile penetration. According
to Communications Outlook 2009, Although
there was a general consensus among witnesses that consumer prices were higher
in Canada for certain wireless services such as mobile phone and text
messaging, some witnesses argued that price comparisons are inherently
difficult to make across the global telecommunications industry. Indeed,
comparing prices of telecommunications services is not like comparing the price
of a relatively homogenous product such as gasoline across countries; it is a
complex endeavour and results are often heavily influenced by the methodology
used. In fact, Internet, phone and cable are often “bundled” into a pricing
package making it difficult to estimate precisely the price of each service.
Although
there was a general consensus among witnesses that consumer prices were higher
in Canada for certain wireless services such as mobile phone and text
messaging, some witnesses argued that price comparisons are inherently
difficult to make across the global telecommunications industry. Indeed,
comparing prices of telecommunications services is not like comparing the price
of a relatively homogenous product such as gasoline across countries; it is a
complex endeavour and results are often heavily influenced by the methodology
used. In fact, Internet, phone and cable are often “bundled” into a pricing
package making it difficult to estimate precisely the price of each service. With respect to fixed (wire line) telephony, Canada is the country
with the 18th lowest prices in the ITU study. In the OECD
study, Canada has the lowest prices for high-use residential fixed lines, the 3rd lowest prices for medium use, and the 6th lowest prices in the
low-use segment. In the business fixed line segment, Canada has the 20th lowest
prices in the OECD study for small/home office, and the 15th lowest
prices for medium-sized enterprises.
With respect to fixed (wire line) telephony, Canada is the country
with the 18th lowest prices in the ITU study. In the OECD
study, Canada has the lowest prices for high-use residential fixed lines, the 3rd lowest prices for medium use, and the 6th lowest prices in the
low-use segment. In the business fixed line segment, Canada has the 20th lowest
prices in the OECD study for small/home office, and the 15th lowest
prices for medium-sized enterprises.
![Text Box: [...] the large incumbents, whose ubiquitous networks were in significant measure funded by the foreign capital now not available to competitors, can leverage their economies of scale and free cashflow to significantly but incrementally invest in their existing networks. This investment is inherently less risky and consequently inherently more attractive to Canadian sources of investment.
Mr. Chris Peirce (Chief Corporate Officer, MTS Allstream Inc.), Standing Committee on Industry, Science and Technology, Evidence, 3rd Session, 40th Parliament, April 15, 2010, 1010.](/content/Committee/403/INDU/Reports/RP4618793/indurp05/images/5-e.jpg) operating
margins for the three major players are similar, and not much disparity exists
in their respective market shares.
operating
margins for the three major players are similar, and not much disparity exists
in their respective market shares.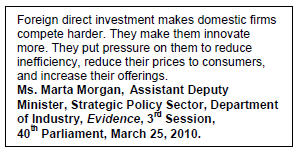 The
market features described in the previous section have been used by some
commentators to argue in favour of removing foreign ownership restrictions. They
suggest that such a change in policy would ultimately increase the level of
competition in the Canadian wireless market, thereby improving some of the
market characteristics. Previous reports on foreign ownership restrictions have
put forth several macro-economic arguments in favour of removing them. For
example, the 2006 Telecommunications Policy Review Panel Report points out that
the entry and growth of foreign firms adds to competitive pressures on all
firms in the market. The report also suggests that foreign investment can be a
driver of economic efficiency through the “adoption” of foreign technology, the
appropriation of investments in human capital and adoption of new strategic
management approaches by domestic firms.
The
market features described in the previous section have been used by some
commentators to argue in favour of removing foreign ownership restrictions. They
suggest that such a change in policy would ultimately increase the level of
competition in the Canadian wireless market, thereby improving some of the
market characteristics. Previous reports on foreign ownership restrictions have
put forth several macro-economic arguments in favour of removing them. For
example, the 2006 Telecommunications Policy Review Panel Report points out that
the entry and growth of foreign firms adds to competitive pressures on all
firms in the market. The report also suggests that foreign investment can be a
driver of economic efficiency through the “adoption” of foreign technology, the
appropriation of investments in human capital and adoption of new strategic
management approaches by domestic firms.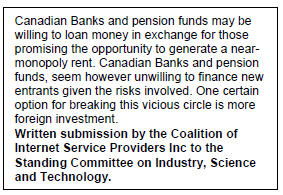 Having
established the critical importance of having as low a cost of capital as
possible, particularly for SPNEs, the question is then: how do Canada’s foreign
ownership restrictions in the telecommunications industry potentially increase
the cost of capital? As explained during the Committee’s hearings, the more
diverse the potential pools to supply this capital requirement, the better. As
a result of Canadian ownership restrictions, SPNEs are limited to the Canadian
capital market (traditionally more risk averse than the foreign market) for the
majority of their capital requirements. This constitutes a competitive
disadvantage since the SPNEs business model is inherently more risky. Access to
a greater variety of capital pools could therefore mean a lower cost of capital
for SPNEs. The representative of Globalive Communications Corporation offered
the following comment to illustrate the link between cost of capital and access
to foreign capital:
Having
established the critical importance of having as low a cost of capital as
possible, particularly for SPNEs, the question is then: how do Canada’s foreign
ownership restrictions in the telecommunications industry potentially increase
the cost of capital? As explained during the Committee’s hearings, the more
diverse the potential pools to supply this capital requirement, the better. As
a result of Canadian ownership restrictions, SPNEs are limited to the Canadian
capital market (traditionally more risk averse than the foreign market) for the
majority of their capital requirements. This constitutes a competitive
disadvantage since the SPNEs business model is inherently more risky. Access to
a greater variety of capital pools could therefore mean a lower cost of capital
for SPNEs. The representative of Globalive Communications Corporation offered
the following comment to illustrate the link between cost of capital and access
to foreign capital: