|
BACKGROUND
Chapter 4
Fragmenting Audiences
In the view of the CAB and its members, the 1991 Broadcasting Act has worked well. It has successfully provided a legislative framework under which the Canadian broadcasting system has been able to flourish and adapt over the past 10 years.
Canadian Association of Broadcasters, Brief
What we have reluctantly concluded is it is now time to admit we have failed. After half a century of government support measures for Canadian television, and an even longer period of support for movies, it remains virtually impossible for me to find a Canadian story on either the big or small screen.
Thor Bishopric, President, Alliance of Canadian Cinema, Television and Radio Artists, Meeting of Standing Committee on Canadian Heritage, 9 May 2002
We cannot make Canadians watch more Canadian programs. No one can, and no one wants to.
Robert Rabinovitch, President, CBC, Meeting of the Standing Committee on Canadian Heritage, 14 March 2002 |
After its review of several hundred submissions and the many hours of witness testimony that it gathered, the Committee notes that there is a distinct range of views about the state of the Canadian broadcasting system. Some witnesses believed that there has been a good deal of success, but that there are problems and issues to deal with. Others were more pessimistic, including some who believe that we have failed. Some were more matter-of-fact and offered reminders that any success in Canadian broadcasting hinges on finding a balance between cultural and economic objectives.
To help make sense of these different views, this chapter presents information about the various measures that are used to talk about radio listeners and television audiences. It discusses the concepts of prime time, types of programming and the availability of radio and television programs. Thereafter, it presents selected summary information on
available Canadian programming and Canadians' listening and viewing habits. This chapter also shows how uses of certain technological innovations over the last half century have reshaped our communications environment and, by extension, the leisure time activities of Canadians. Finally, it describes some of the ways in which the Internet revolution has precipitated significant and ongoing changes in media consumption behaviours and expectations.
The way people use the broadcasting system has changed substantially over the last 50 years. Following its introduction in the early 1950s, television quickly became popular and, as a result, altered the uses and importance of radio. The emergence of cable syste)ms in the 1970s increased significantly the number of channels that could be accessed and made possible the introduction of channels that specialize in particular topics. In the 1980s, videocassette machines made it possible to record television programming and view pre-recorded movies. During the 1990s the Internet became a workable system for people to listen to audio, watch streaming video or subscribe to electronic editions of newspapers that are updated several times a day.1 Most recently, viewing by appointment has become easier than ever before with the introduction of the personal video recorder.
In the early days of radio or television a "broadcast" was a program transmitted at a specific time to an audience. If you did not tune in at the right time, you "missed" the show. Those who grew up in the 1950s and 1960s probably still think of broadcasting this way. But as seen by the review of technological innovations outlined in Chapter 3, notions of broadcasting have shifted from an emphasis on reaching a mass audience to providing the widest possible range and volume of programming content.
Although it is highly unlikely that anyone will offer an unlimited number of television services in the near future, it is important to remark on a number of important implications that are related to this capacity.
| • | First, the majority of households in Canada no longer rely on over-the-air signals (i.e., the radio frequency spectrum) for the reception of broadcasts. |
| • | Second, there is no longer an absence of choice. |
| • | Third, there will be further audience fragmentation as more distribution services begin offering subscriptions to different types of programming on demand. |
These changes, all of which were happening to some degree as the Committee carried out its study, have important consequences for the way the government organizes its efforts to promote the production, distribution and exhibition of Canadian programming.
The remainder of this section reviews what can be said about Canadian programs, their overall availability, how they are watched and the implications of existing trends.
Definitions of Listening and Viewing
To gauge the achievements of the Canadian broadcasting system it is important to distinguish between radio and television. It is also necessary to distinguish among the various categories of programming such as sports, news, children's and drama.2
The most common viewing statistics collected by the broadcasting industry are: penetration, coverage, reach, audience size, ratings, share, and average minute audience. These terms are defined by the industry as follows:
| • | Penetration: The number of households with a radio or television set. |
| • | Coverage: The extent of a medium within a geographic area.3 |
| • | Reach: The estimated number of different persons who tune to a station or to television for at least one quarter hour within a specified time period.4 |
| • | Audience size: The share of television or radio sets that are turned on. Measured either in raw numbers or as a percentage. The broadcasting industry generally uses a measure of the average quarter hour audience, which is determined by adding all the individual quarter hour audiences and dividing by the number of quarter hours involved.5 |
| • | Rating: The average quarter hour audience expressed as a percent of the population in a geographically defined area.6 |
| • | Share: The percentage of the total number of people watching television who are tuned into a particular station or program.7 |
| • | Average Minute Audience (AMA): The average number of viewers tuned in each minute of a program. |
As seen above, there are several measures of audience for a broadcast, including: audience size, reach, share and average minute audience. Subsequent sections will provide some examples of audience data for English and French television. Before proceeding, however, it is important to point out that the broadcast industry's measurement methods for audience size differ from the way other activities tend to be reported. As Nielsen Media Research Canada notes:
... a "TV rating" is not the same as the common usage of the word "rating". Nielsen Media Research does not provide qualitative evaluations of how much a program is "liked" when we rate programs. The TV rating is only the simplest and most democratic measure of the audience: how many people watched. Programs which have larger audiences are, by definition, the successful ones. Ratings numbers which you may have seen are the average audience rating, or the percent tuned to a particular program during the average minute.8
A second difference can be illustrated by looking at the difference between overall citizen participation in an election and reported television audiences. Election turnout is normally reported as the percentage of people who voted based on the total number of eligible voters. However, when an audience share for a television show is reported, the baseline is not the total number of televisions that could have been turned on, but the percentage of people who were watching a show based on the total number of people who were watching television at that same time.
This interpretation of audience share has great utility for advertisers, but can be misleading if used to appraise the success of Canada's broadcasting policy. As the Canadian Film and Television Production Association (CFTPA) recently explained: "traditional forms of audience measurement methodology serve the purposes of advertisers [and] are not necessarily an indication of the true audiences for Canadian programs."9 For this reason,
the CFTPA believes a new measure, based on the total number of Canadians who watched at least 30 minutes of a Canadian show during a full season of telecasts, should be used to appraise the "real impact" of Canadian programming. This proposed approach would be called "season reach."10 For example, a measure of "season reach" might be two or three times the traditional audience share numbers.
Seen in another light, one could also imagine the use of a measure called "episode reach." Such a measure would collect viewing data for the broadcast of a single episode and a set number of repeats of the same show (on the same, or on another channel). For example, a typical episode of Da Vinci's Inquest enjoys an audience of about 700,000. If one were to add the audience data for two repeats of the same episode, it is quite probable that the number of viewers would exceed 1.5 million. With this in mind, Chapters 5 and 19 make recommendations concerning the need to improve existing data collection and reporting methods for the Canadian broadcasting system.
It is also important to remember that there are differences between the way people use radio and television. Radio listening tends to be concentrated during the day, while in a car or at work, whereas television viewing tends to be done in the home. Audiences for television tend to be highest between 4:00 p.m. and midnight (i.e., after school or a workday), a period of which varying portions have been, or are referred to, as "prime time."
Radio
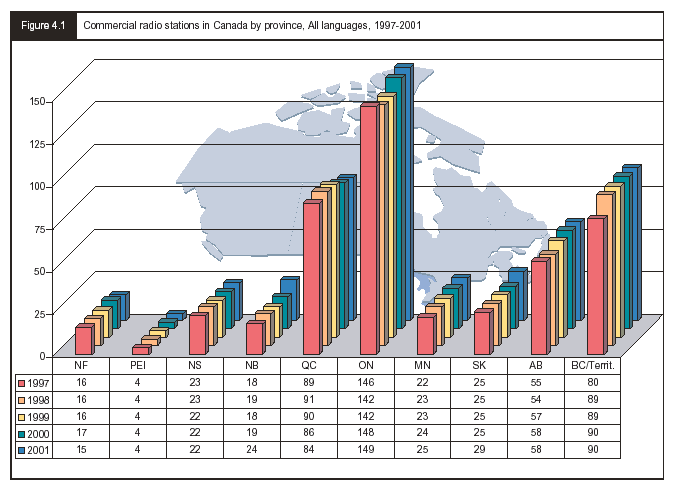
The situation that confronted the Aird Commission in the 1920s, when Canadians were justifiably concerned about the absence of Canadian radio programming, no longer exists. As figure 4.1 shows, there are 500 commercial radio stations11 owned and operated by Canadians that produce and deliver thousands of hours of Canadian music and programming each year.12
|
 |
|
Most radio stations are intensely local, covering local news, events and advertising local businesses. The exception to this is the Canadian Broadcasting Corporation's English- and French-language national radio services.
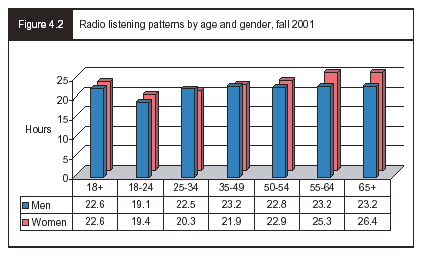
According to Statistics Canada, in 2001, Canadians listened to approximately 21.7 hours of radio each week. Figure 4.2 shows fall 2001 radio listening patterns by age and gender.
Additional statistics on Canadian radio listeners' preferences are presented in Chapter 8.
Television
Canadian television services are divided into different categories determined by the technical means they use to reach audiences and the types of programming they offer. This report will mostly talk about two types of broadcasters:
| • | Conventional broadcasters: those that reach their audiences via an over-the-air signal or a distribution undertaking, such as cable or satellite. |
| • | Pay and specialty services: those that can only be obtained by audiences via a distribution undertaking. |
Conventional broadcasters usually offer a broad range of programs (e.g., local and national news, drama, game shows, sports), whereas specialty services tend to focus on a specific theme (e.g., sports, cartoons, news). CBC, CTV, Global, TVO/TFO, Citytv, A-Channel, Radio-Canada, TVA, TQS, TéléQuébec are the most well-known examples of English and French conventional broadcasters.
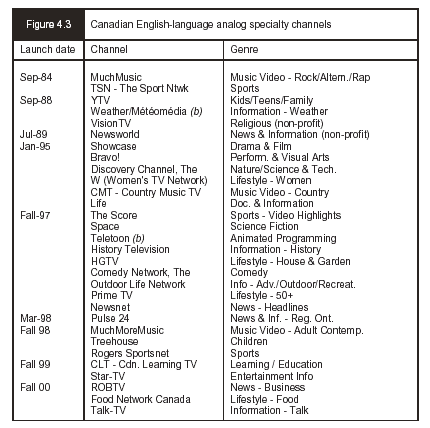
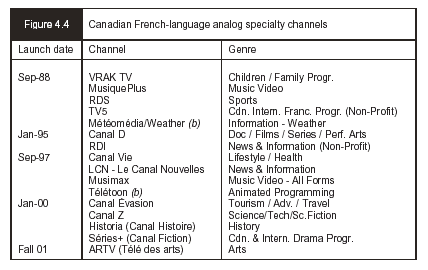
As for specialty services, there are two varieties: analog and digital. Analog specialty services have been available since 1984. Canada's English and French-language analog pay and specialty services are listed in figures 4.3 and 4.4.
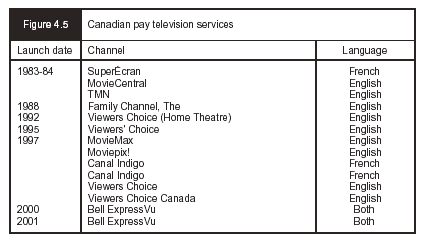
As for pay services, figure 4.5 shows the English- and French-language channels to which Canadian may subscribe.
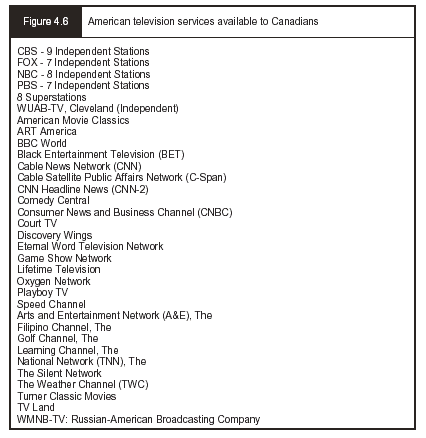
Canadians also receive a number of foreign services, most of which are American. Those American services that have been granted access to Canada's broadcasting market by the CRTC are listed in figure 4.6.
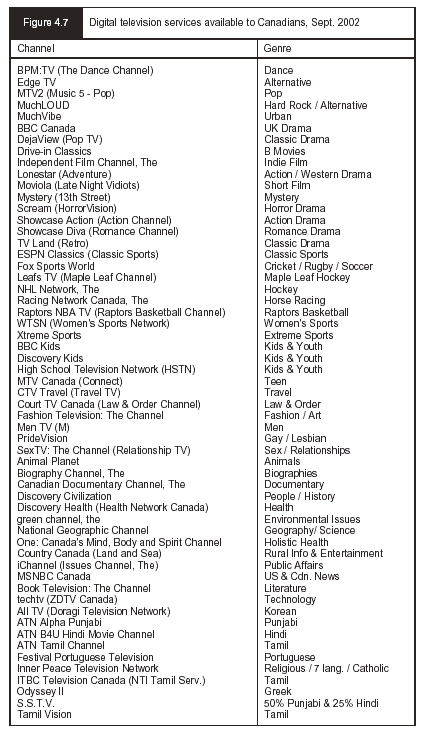
Apart from analog services are another 260 pay and specialty channels that were licenced for digital distribution in Canada by the CRTC in
2000. To date, nearly 60 of these have been launched and made available to subscribers via cable or satellite. These services are listed in figure 4.7.
Finally, there are four over-the-air multilingual ethnic television stations, operating from Toronto (OMNI 1 and OMNI 2), Montreal (CJNT) and Vancouver (MVBC). There are also five analog Canadian ethnic specialty services (available on a discretionary basis): Fairchild TV, Talentvision, SATV, Odyssey and Telelatino. Furthermore, in 2000, the Commission authorized more than 50 ethnic digital specialty and pay services in a variety of languages. To date, eight specialty and two pay services have been launched (see figure 4.7).
Programs Types
As noted above, conventional broadcasters tend to focus on general types of programming, whereas specialty channels have a much more specific focus. Not surprisingly, different channels attract different audiences. Thus, to understand what is being viewed, it is necessary to pay particular attention to the kinds of programs offered.
Audience interests have changed considerably since the early days of television. These changes have in turn led to changes in the definitions used for programs. This makes it very difficult to compare a given time period, such as 1963, with the situation in 1993 or 2003.
It is also important to note that the definitions used to describe programming categories were created by regulators and governments for administrative purposes. For example, the 1957 report of the Royal Commission on Broadcasting identified the following categories of television drama: serious, domestic, comedy, crime, western, action and science fiction, romantic, musical comedy and other. During the period that this committee was conducting its study of broadcasting, CBC Research was using five categories of drama: movies, action/adventure, situation comedies, reality programs and an other category that included miniseries and soap operas. The drama and comedy category used by the CRTC, which is presented in Chapter 5, has seven different types of programs, one of which includes puppet shows.
A further difficulty is that categories may not accurately reflect what analysts might want or expect. This means that one must be very careful when making claims about what Canadians are watching, or about the overall health of the system. The best example of this is the CRTC's
decision to group drama and comedy in one category, an aggregation that makes it almost impossible to separate overall audiences for drama or comedy.
Prime Time and Scheduling
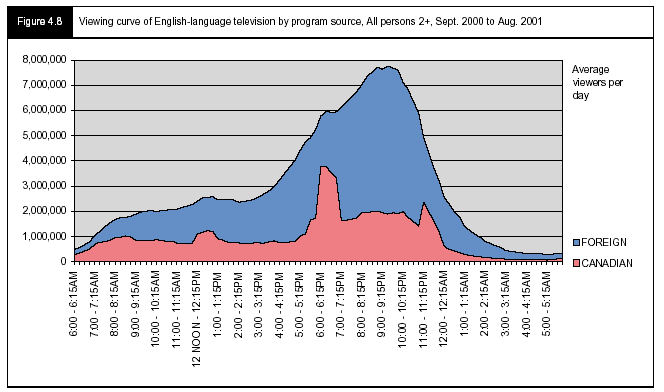
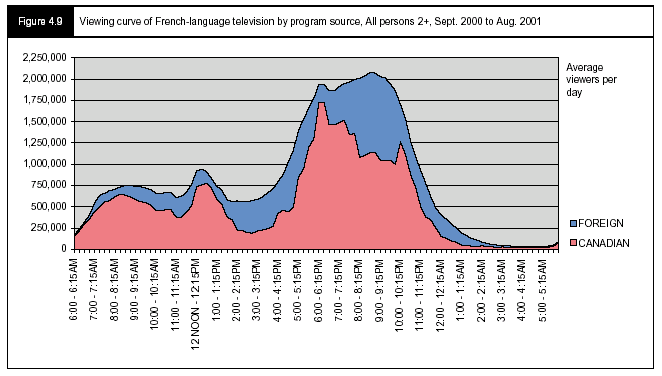
Since the earliest days of television, most viewing has taken place during the evening hours. This period is referred to as the "peak viewing period" or "prime time" and has been defined in many different ways over the past five decades. For example, the Board of Broadcast Governors (BBG) and later the CRTC required Canadian television stations to fill 55% of their broadcasting day with Canadian programs and 40% between 6.00 p.m. and midnight. Today, CRTC regulations emphasize the period between 7:00 p.m. and 11:00 p.m., because this is the time when television audiences are typically at their largest. While the period from 7:00 p.m. to 11:00 p.m. is important, it is worth noting, however, that there are large audiences for television outside this "peak time." Figures 4.8 and 4.9 show the extent to which audiences for television vary during the 24-hour broadcast day used by Nielsen Media Research.
These figures show that large numbers of Canadians watch television throughout the broadcast day. On almost any day there are at least 2 million English-speaking Canadians, and more than 500,000 French-speaking Canadians watching television between 10:00 a.m. and midnight. Thus, while it is true that overall viewing peaks notably between 7:00 p.m. and 11:00 p.m., it can also be seen that more than 50% of television viewing for both English and French television takes place outside prime time.
The amount of television that Canadians watch also varies by day of the week. According to CRTC data, Monday, Thursday and Sunday are the most popular days with viewing at its highest on Thursday. Viewing also varies with the season. It is higher during the fall and winter and lower during the spring and summer. Major holidays also have an impact on television viewing.
A further complication to a full understanding of what is watched and when it is watched is ongoing changes in definitions of Canadian content. This topic is considered in detail in Chapter 5. Additional details are also presented in Appendix 8.
|
 |
|
Because a large number or people watch television during "prime time" television networks schedule what they hope will be popular shows during peak viewing hours. Some shows are more successful than others, thus there is a constant effort to adjust the program schedule to take account of what the other networks are doing. If a show is extremely popular and attracts large audiences, other networks are reluctant to pit their shows against a known winner.
There are several reasons for this. First, a show usually takes some time to build an audience so a new show will not be helped if it is scheduled against very strong competition. Second, a television series is expensive and little is gained if a potentially successful show is scheduled in an inappropriate time slot or against a program that is already very successful. Third, simultaneous substitution (which is described in Chapter 8), by virtue of the revenues it can generate for Canadian broadcasters, can also affect scheduling decisions.
Decisions about scheduling are not easy to make. Given the fierce competition, it is easy to see why English-language Canadian networks prefer to have a range of options (e.g., a movie of the week, a miniseries, or a series) in their efforts to deal with the competitive pressures they face.
Strategies for dealing with these pressures vary. A program that was scheduled on a Thursday night might be moved to another time slot because the competitive pressure is less or because the network has acquired rights to a foreign program that has to be broadcast at the same time. Frequent schedule changes make it difficult to build an audience for a show. These pressures are not the same for sports, news, public affairs, and children's programming. They are, however, a constant reality for English-language Canadian drama.
Measuring Audiences
Two techniques are used to determine audience size and what people are watching. One method is a diary that is filled out by a person who has agreed to participate in an ongoing study of television viewing habits. Another technique uses a meter that is attached to a television set, which keeps track of when the television is on, what program is being watched and who is watching.
The diary system relies on the individual participating in the study to record when television viewing took place and what was watched. It is
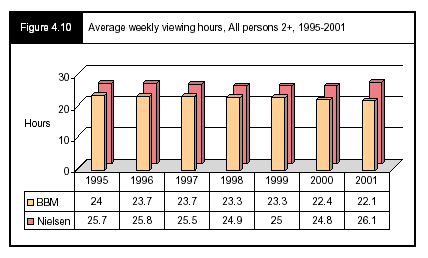
frequently filled in at the end of the evening, the next day or even at the end of the week. It is also based on a 20-hour broadcast day (6:00 a.m. to 2:00 a.m.). The diary system probably underreports television usage. In particular, it likely underreports the use of specialty services, which people will often turn to for a few minutes to check something of interest, such as the weather or the headlines. The statistics prepared from diaries indicate that people watch television between 22 and 24 hours per week.
The people meter has the advantage that it tracks every program that someone watches as soon as the television is turned on and covers a 24-hour broadcast day. It also records each time the channel is changed. Some analysts therefore consider it to be a more accurate measure of the way people watch television. Statistics based on the people meter suggest that Canadians, on average, watch between 24 and 26 hours of television per week.
This estimate is higher than the diary method for at least two reasons. First, the people meter captures television viewing that might be forgotten by a diary user trying to recall what was watched several hours or days after the fact. Second, the people meter probably overestimates the amount of television watched, given that some people turn the television on but are not necessarily watching.13
For these reasons, it is likely that the actual amount of television watched by Canadians is more than that measured by the diary method and less than that measured by the people meter. In Canada, the Bureau of Broadcast Measurement (BBM) uses the diary method and Nielsen Media Research uses the people meter. Figure 4.10 shows BBM and Nielsen's television tuning data for the period 1995-2001.
Both systems involve representative samples of households that have agreed to participate in the measurement process. Statements about audience share require one to add all of the results from those who participate (either using the diary or the meter) to generate an estimate of what is going on in the country at large. There are, however, limits to what can be said about audience shares. Some groups of people, for example, francophones outside of Quebec and Northern and Aboriginal audiences, are generally not included as part of the survey population for studies of television or radio usage. This means very little can be said, or is known, about these groups' viewing and listening habits. A second problem has to do with the sheer number of channels that people can watch and the year-long period that they can be watching.
These problems are handled in a number of ways. Researchers at CBC English television, for example, use a six-week sample (42 days: 6 Mondays, 6 Tuesdays and so on) to develop an overview of the broadcast year. Radio-Canada uses BBM data, and the CRTC uses a combination of both systems. Other researchers (e.g., Statistics Canada) use a summary of diary results for the fall viewing season to draw conclusions about the broadcast year.
All of these techniques have their strengths and weaknesses. Needless to say, they are used by different organizations for different purposes and the results cannot be easily compared. "Sweeps week," for example, is a period when American television networks are trying to obtain the highest audience shares possible by scheduling either their best shows or a series of specials to attract large audiences. The networks do this to convince advertisers that the network has a large audience of the type of people that advertisers are trying to reach. Since advertising rates are higher for larger audiences, sweeps week is an important element in the marketing strategy of a television network, but a problem for a Canadian broadcaster trying to maximize audiences to Canadian programming. This is why Canada's English-language broadcasters tend to avoid scheduling new Canadian programs during periods that coincide with sweeps week. Thus, while sweeps week is understandable from an economic standpoint, it is important to remember that it is not representative of the overall performance of Canadian programming on Canada's English-language networks.
Taken as a whole, it can be seen why these various considerations created problems for the Committee in its efforts to assess the state of the Canadian broadcasting system. Indeed, every group that appeared before the Committee used the available statistics to support a particular argument. This means that great effort was required to appraise the validity of claims made by witnesses.
It is worth noting, however, that technological advances should significantly improve existing measurement systems. BBM, for example, has recently introduced the "portable people meter," a pager-sized device that is carried by a representative panel of television viewers. This device, "automatically detects inaudible codes that broadcasters embed in the audio portion of their programming."14 This type of metering system is being introduced in television markets across Canada and will eventually replace existing measurement systems. Since this device is portable and demands less attention than the diary system, it is expected that it will
provide more accurate measurements of people's use of all types of electronic media including radio and television, no matter where they might be.
In summary, depending on the measurement technique, it is estimated that Canadians watch somewhere between 22 and 26 hours of television per week, an average that has remained relatively constant over the past 35 years.15 Since almost all Canadian households have a television, the potential audience for television at any point during a 24-hour period is approximately 31 million people divided into about 12.3 million households.16 At the peak viewing time, however (i.e., between 7:00 and 11:00 p.m.), about eight million households have the television turned on (i.e., about 65%), and around two million households are watching Canadian programming (i.e., about 15%).17
The next few sections describe the types of programming available, and the audience share for these different types of programs. It then provides detail on changes in audience shares for French and English-language Canadian drama.
Available Services
In recent years, there has been a substantial increase in the number of services available. In the mid-1950s few Canadian households had access to more than three or four channels. This number increased steadily during the 1960s and 1970s and has skyrocketed since the mid-1980s, to such an extent that upwards of 375 channels are now available from some Canadian distributors.
This is a very significant change. As Mr. Michael Helm, Director General, Telecommunications Policy Branch, Industry Canada, explained to the Committee:
I used to work in broadcasting within government. [Channel availability and choice] was an ongoing concern. Frequently, from remote areas all over the country we received complaints and concerns. People who lived in Toronto and Ottawa and Montreal and Vancouver had such a richness of broadcasting, of television channels available; why couldn't government do a better job of seeing that people in remote areas had as well? This went on for years — I'm sure you can remember — and it was a very real concern.
I haven't heard a concern or a complaint like that in four or five years — none, zero — because satellite technology, essentially, solved the problem. You can now live on the remotest farm in the remotest part of the country and get a range of television and radio services at about the same price — a comparable price — to someone in the downtown area of the biggest city.18
The fact that these services are generally available, however, does not mean that all households — whether rural or urban — can equally afford the same level of service.
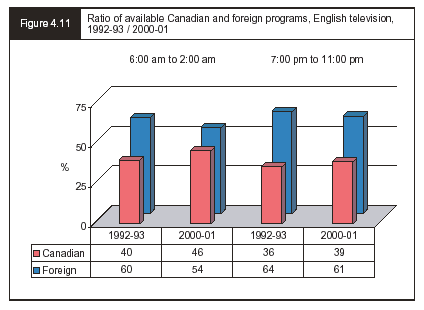
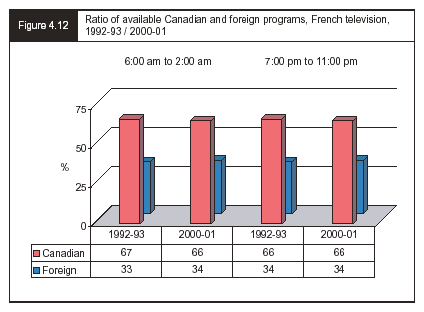
As the availability of television services has increased over the last 10 years so too has the overall number of hours of Canadian content available to watch. Furthermore, the availability of Canadian programming versus foreign options has over the past decade narrowed somewhat for English television and remained stable for French television. figures 4.11 and 4.12 present these data for 1992-93 and 2000-01.
These data reveal that between 1992-93 and 2000-01, the all day supply of Canadian programming increased to nearly half (46%) of available English-language programs and remained stable at about two-thirds (67%) of available French-language programming.
Viewing Share
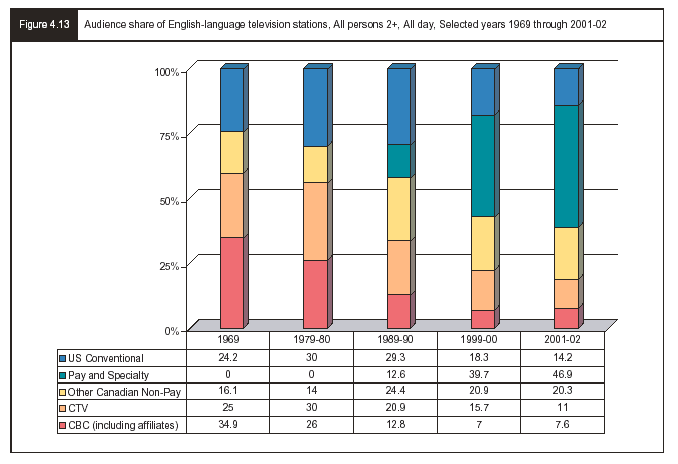
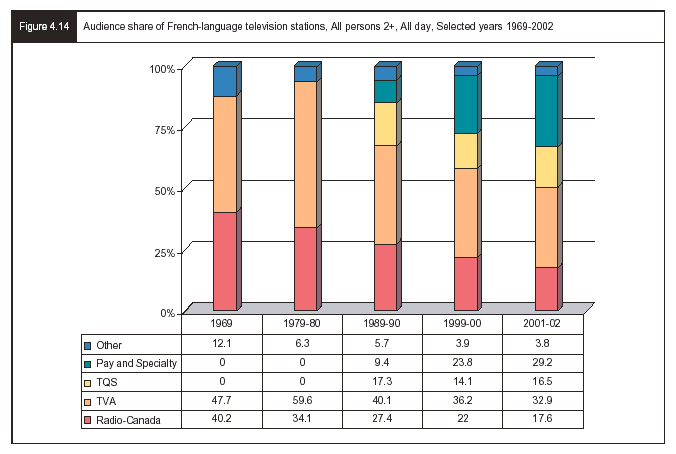
In the early years of television, audience shares that exceeded 40 or 50% were commonplace. Figures 4.13 and 4.14 show the extent to which audience share has fragmented over the past 30 years. In 1969, for example, the CBC (including affiliates, when carrying CBC programming) enjoyed a 35% audience share, while CTV was garnering 25%. That same year, Radio-Canada was averaging 40% of all French viewers and TVA was enjoying a share of nearly 50%. In 2001-02, the CBC was down to just 7.6% of the English-speaking viewing audience and CTV was down to 11%. Similarly, Radio-Canada was down to 17.6% and TVA was being viewed by about one-third of the French-speaking audience.
By contrast, the overall audience share for pay and specialty services has enjoyed dramatic increases in recent times. For example, between 1989-90 and 2001-02, the audience share for English-language pay and specialty services increased from 12.6% to 46.9%, while in the French-language market it increased from 9.4% to 29.2%.
|
 |
|
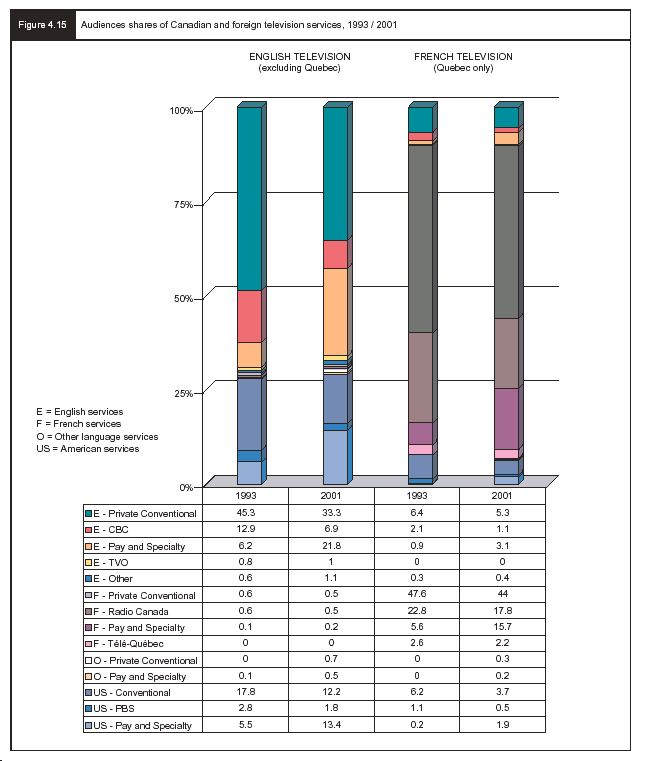
Figure 4.15 shows audience share broken down in greater detail for fall 1993 and fall 2001. This figure reveals that Canadian-owned services dominate the Canadian television market, with about a 66% audience share in Canada (excluding Quebec), and a 90% share in Quebec.
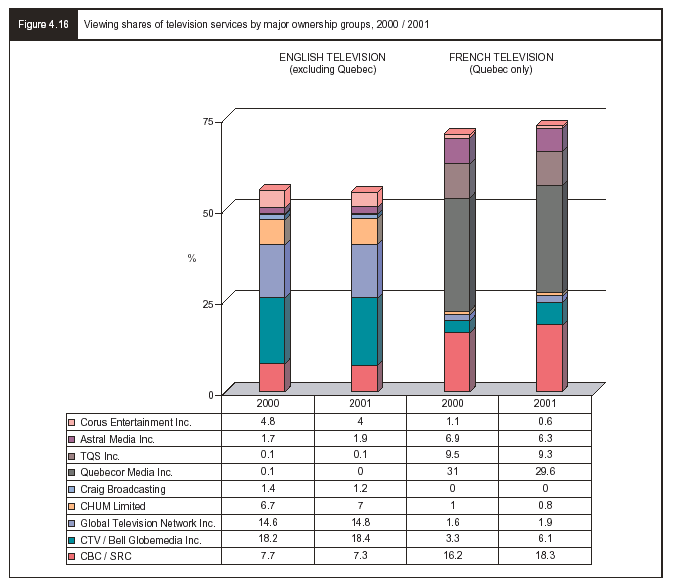
Another interesting way to look at audience share is to break it down by ownership group. As several witnesses told the Committee, broadcasting in Canada in recent years has been characterized by an effort by conventional broadcasters to reassemble the fragments; that is, to regain lost audience share by acquiring pay and specialty channels. In doing so, even if viewers are not all watching the same programs, they are at least watching channels operated by the same ownership group.
|
 |
|
For the CBC this particular turn of events has been particularly trying. While many private ownership groups have in recent years been granted new pay and specialty service licences, the CRTC has consistently denied new licence requests to the CBC, with the exception of two news channels (Newsworld and RDI), and some recently licenced digital services (Country Canada, The Documentary Channel and ARTV). A recommendation that addresses future CBC licence requests is made in Chapter 19.
|
 |
|
Figure 4.16 shows the most recent combined viewing share data for Canada's major ownership groups. As can be seen, in fall 2000 and fall 2001, CTV/Bell Globemedia, Global TV and CHUM Ltd. enjoyed 18%, 15% and 7% combined viewing shares, respectively (excluding Quebec). Meanwhile, the CBC had a 7.3% audience share in fall 2001. In the province of Quebec, by far the most dominant ownership group in 2001 was Quebecor with an audience share of about 30%, while Radio-Canada was second at 18.3%.
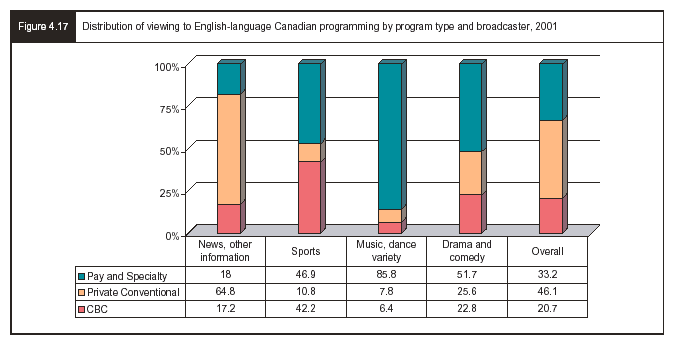
Yet another way to understand viewing habits is to look at the types of programs Canadians watch. Figure 4.17 gives some sense of what Canadian programming English-speaking Canadians watch in an average week.
|
 |
|
As can be seen, in 2001, Canada's English-language private broadcasters (between 6:00 a.m. and 2:00 a.m.) attracted nearly 65% of all viewing of Canadian news programming and about 26% of all viewing of Canadian drama and comedy programming. In contrast, during this same period, the CBC attracted 42.2% of all viewing of Canadian sports, whereas the private conventional broadcasters garnered just 10.8% of the viewing audience. Overall, 46.1% of all viewing of Canadian programming was to private conventional networks, about one-third was to pay and specialty services, while 20.7% was to the CBC in 2001.
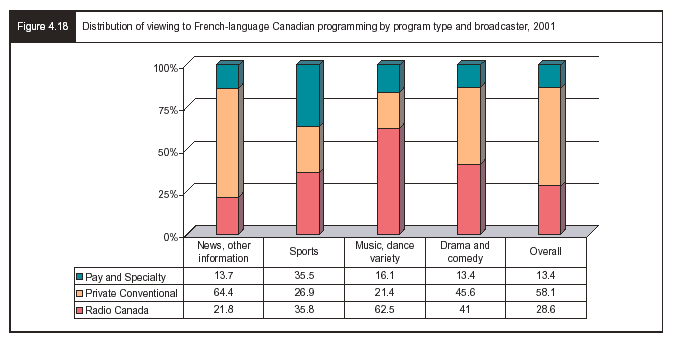
Figure 4.18 shows the same viewing data for French television in 2001. These data reveal slightly different viewing preferences for French-language audiences to Canadian-made programming.
|
 |
|
Overall, 28.6% of all viewing of French-language Canadian programming in 2001 was to Radio-Canada, 58.1% was to the private conventional networks, and just 13.4% was to pay and specialty services (between 6:00 a.m. and 2:00 a.m.). With respect to drama and comedy, Radio-Canada performed well, generating 41% of all viewing, while the private networks attracted 45.6% of all viewing of this genre. As for sports, the divide was far less than that seen for English-language broadcasters. Radio-Canada was still the most popular sports broadcaster in Canada, attracting 35.8% of all Frenchlanguage viewing of sports shows. Meanwhile, 64.4% of all viewing of Canadian news was to the private conventional broadcasters and 21.8% was to Radio-Canada.
What is being watched?
While the bulk of what people watch consists of news, sports and drama, it is important to note that viewing habits vary considerably. Some people may watch only sports and news, while others are interested in gardening and the weather. The Committee was told on several occasions that most people watch 6 or 7 channels despite having dozens, if not more than 300, from which to choose. The problem for today's broadcaster, however, is that very few people select the same six or seven channels.
What is watched changes over time. Comedy shows such as Wayne and Schuster in the 1950s, 1960s and 1970s were very popular, and inspired subsequent efforts such as Second City Television, The Royal Canadian Air Farce, The Kids in the Hall and This Hour has 22 Minutes.
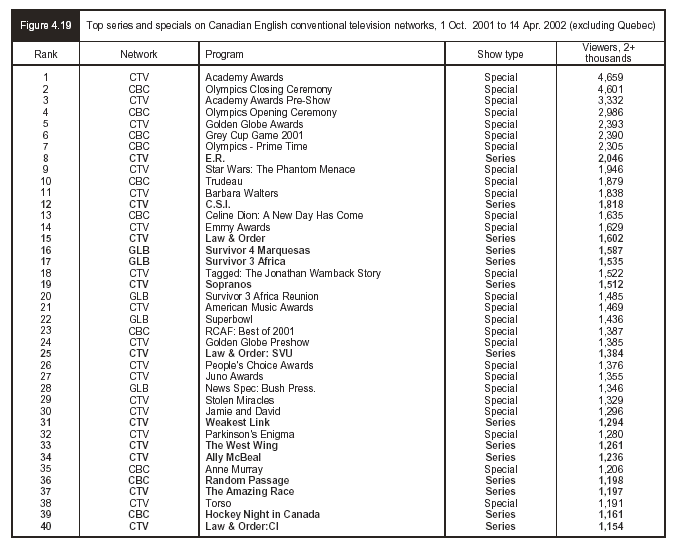
Successful dramas have included The Beachcombers and a string of programs that derive their story line from Lucy Maud Montgomery's Anne of Green Gables. Recent successful programs have included Random Passage, Trudeau, and the CBC's Canadian history series, which was a success in both languages. Figure 4.19 shows the top 40 television series and specials broadcast on Canada's three English-language conventional networks, CBC, CTV and Global, between 1 October 2001 and 14 April 2002.
As can be seen, Canadians (outside Quebec) watch a great deal of American programming. They also watch a great deal of Canadian sports. Indeed, Hockey Night in Canada, which is one of only two Canadian series listed in figure 4.19, has been a perennial favourite since the earliest days of Canadian radio and television (see inset).
Overall, just 16 of the top 40 series and specials in 2001-02 were Canadian, and only 1 of these 16 shows was a regularly scheduled series. Seen another way, 12 of the 14 television series (86%) were American, whereas 15 of the top 26 specials (58%) were Canadian. These data highlight two challenges Canada's English-language broadcasters face: the popularity of American programming and the high cost of making programs that can be broadcast regularly (i.e., 22-26 episodes) over an entire television season. Indeed, the imbalance between the number of popular English Canadian television series and specials to a large extent reflects the fact that it is expensive to produce an entire series as opposed to one or two shows, such as a miniseries or a special event. Subsequent chapters in this report will have more to say about these points.
By contrast, French-language television shows over the years have included: Pays et merveilles (1953-61), Point de Mire (1957-59), two popular information shows of the 1950s, and a host of game shows, miniseries and the ever popular téléromans. These include: La famille Plouffe, Lance et compte, Les Filles de Caleb, La Petite Vie, and Virginie. The long line of success with French-language programming in Canada is quite remarkable.
|
|
English Television's Comedic Canadians
Perhaps the most unusual "policy intervention" in the history of Canadian television came in 1981 when CBC management directed the cast of SCTV to provide more "Canadian content" on the show.
The show was written, produced and performed by Canadians, so this new request was greeted with outrage. "What do you want us to do?" asked Rick Moranis and Dave Thomas, "Throw up a map of Canada and sit there wearing toques and parkas?" The answer was, well, sure, why not?
So originated Canadian Corner and the immensely popular characters of Bob and Doug MacKenzie, who not only became international stars, but who may have done more to help English Canadians recognize themselves and their foibles than any serious TV drama of the day. While "hoser tips", such as how to get a mouse in a beer bottle, may not have been for everybody, there was a quirky recognition factor in the characters and weekly "topics" on the Great White North.
SCTV was only one of many great shows in the history of Canadian comedy. Wayne and Shuster were the pioneers, with sketches that ranged from buffoonery to the "egghead" parodies combining Shakespeare and popular TV genres. "Gimme a martinus!" orders the detective in their Julius Caesar parody. "Don't you mean a martini?" says the bartender — "When I want two, I'll ask for them."
The Newfoundland-based sequence of programs originating with CODCO and extending through This Hour Has 22 Minutes to Made in Canada mine the rich vein of politics as the source material for satire. Canadians cheer Mary Walsh's character Marg Delahunty, in her warrior princess costume, as she ambushes real politicians in their Ottawa offices.
Equally, they cheer the "Chicken Cannon" as it explodes in the faces of their favourite targets on the Royal Canadian Air Farce. But their delight in seeing famous figures skewered is matched by their delight in seeing themselves, as the characters in the Air Farce donut shop solemnly punctuate their observations with, "You got that right. You betcha. Tell me about it! Oh yeah, oh yeah, oh yeah."
Canadian comedy has been one of our most successful export genres as well. Wayne and Shuster appeared a record 67 times on Ed Sullivan. SCTV was still widely syndicated, as was Kids in the Hall. The Red Green Show, with Steve Smith, has been on CHCH, Global, CBC, and is also a cult hit on PBS stations. Equally often, our best talents have gone on to find a worldwide audience: Jim Carrey, Leslie Nielsen, John Candy, Martin Short, Rick Moranis, Dave Thomas, Eugene Levy, Catherine O'Hara, Dan Ackroyd, producer Lorne Michaels of Saturday Night Live, Dave Foley, Phil Hartman, Michael J. Fox, Mike Myers and many more.
Beyond any doubt, satirical sketch comedy has been the most successful of all non-news genres in the history of English Canadian television. And it is not simply a popular success — it's a cultural success as well. In laughing at ourselves, we have seen more clearly who we are. |
|
 |
|
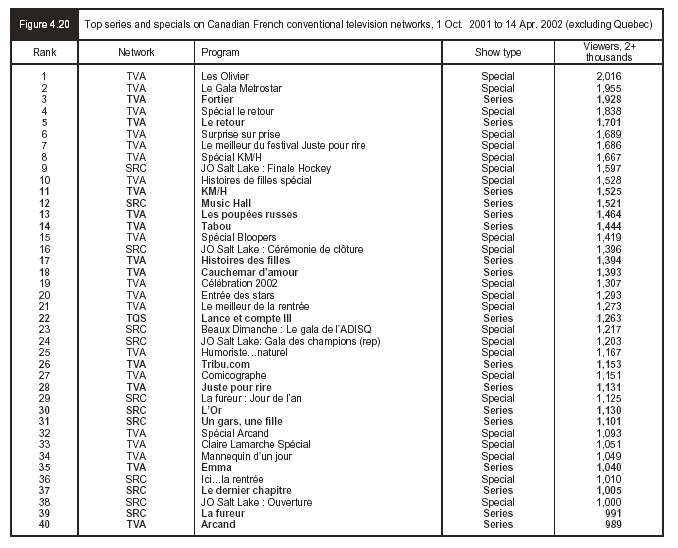
Moreover, as figure 4.20 shows, even in this era of increased audience fragmentation, Quebec's French-language viewers overwhelmingly prefer Canadian-made television shows.
This figure demonstrates the extraordinary extent to which Canadian specials and series dominate French-language television in Quebec. Apart from TVA's, Spécial bloopers, all of these shows are Canadian content. Furthermore, the audience numbers for many of these shows exceed the audiences enjoyed by most English-language Canadian programs listed in figure 4.19. This is particularly remarkable when one considers that the French-language market is just one-third the size of the English-language market.
|
 |
|
These comparisons, however, do not readily show some of the significant increases in the viewing of English-language programming for certain types of Canadian programming. To understand these improvements, it is necessary to examine both the availability of programs and changes in what is watched. These issues are discussed below. |
|
English and French Audiences
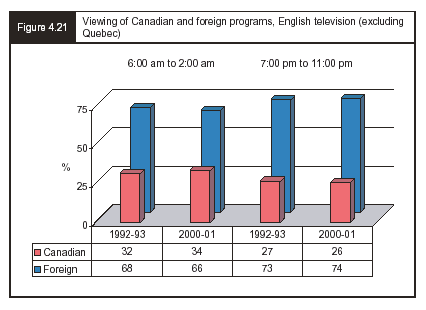
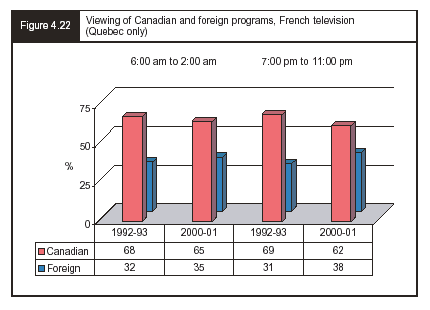
An important point to stress in any discussion of Canadian television viewing habits is the difference between English and French audiences. Factual information on these differences is presented in this chapter as well as in Chapter 5. Figures 4.21 and 4.22 show the viewing of Canadian and foreign programming, by English and French audiences, for 1992-93 and 2000-01.
 |
|
|
The Greats of the Gondola
The popularity of professional hockey games in Canada has evolved alongside the development of broadcasting in our country. We can reasonably conclude that the broadcasting of these games on the radio and, later, television, helped boost the popularity of this sport, and this popularity has remained steady, despite the increased number of sporting events offered by national and international television broadcasters.
The stars of this game, in which speed, strength, imagination and teamwork make an unequalled sporting combination, have been and continue to be heroes that hockey fans latch onto with enthusiasm. The Richard, Orr, Howe, Harvey, Lafleur, Lemieux and Roy have given us long-lasting pleasure and joy.
Nevertheless, we should bear in mind that the exploits of hockey stars were described and conveyed to us by two remarkable commentators whose careers were intimately tied to the development of hockey as Canada's national sport. Their respective careers were closely linked to the evolution of broadcasts of hockey games in Canada: Foster Hewitt, beginning in the late 1920s, and René Lecavalier, beginning in the early 1950s.
Foster Hewitt began broadcasting the games of the Toronto Maple Leaf on radio in 1927. Ken Dryden, one of the greats of the National Hockey League, in recalling his youth, described the impact this commentator made on him: "From his gondola nearly 20 metres above the ice at Maple Leaf Gardens, Hewitt became our national storyteller, growing in status beyond even those great players he talked about, outlasting them all. He helped to create a national habit."
In the early 1950s, in Montreal, one of Foster Hewitt's young colleague also began making his mark, with his marvelously articulate descriptions of professional hockey. René Lecavalier had a fiery passion for hockey, a sport he was intimately familiar with—like grammar, in fact. He was able to combine for television viewers a great love of the sport and a love of the French language. For more than 30 years, René Lecavalier made us rediscover a sport that, for him, held all the beauty, demands and subtleties of the language he used to describe it. Broadcasting launched René Lecavalier's career in a new direction in the world of sport, and we are the better for it. He kept his eye on the game courteously and without stumbling. |
|
|
As can be seen, despite an increase in the supply of Canadian programming available (see figure 4.11), the all-day viewing of Canadian programs increased slightly for English-language audiences, from 32% to 34%, and decreased slightly, from 68% to 65%, for French-language audiences between 1992-93 and 2000-01.
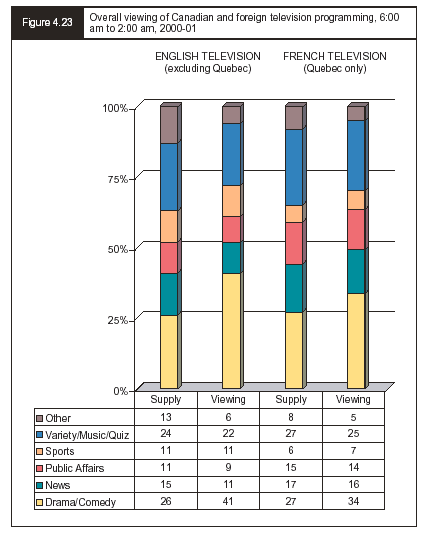
These data, however, cannot tell us what Canadians prefer to watch. One way to tackle this issue is to compare program supply with what is actually watched. Figure 4.23 shows that drama is by far the most popular program type for English and French television viewers, generating 41% and 34% of all viewing, respectively. It also shows that Canadian audiences are more attracted to certain types of programming.
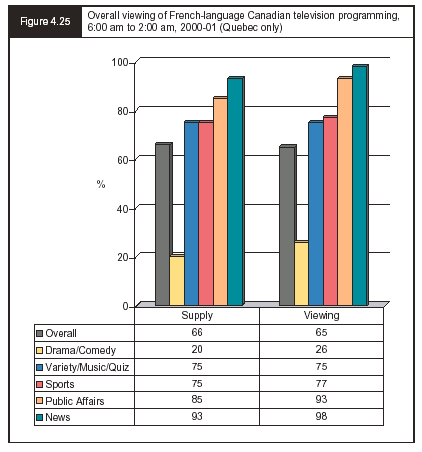
Furthermore, figures 4.24 and 4.25 show that English Canadians watch proportionally more Canadian news and sports than what is available, and watch far less of what is already a modest supply of Canadian drama and comedy.
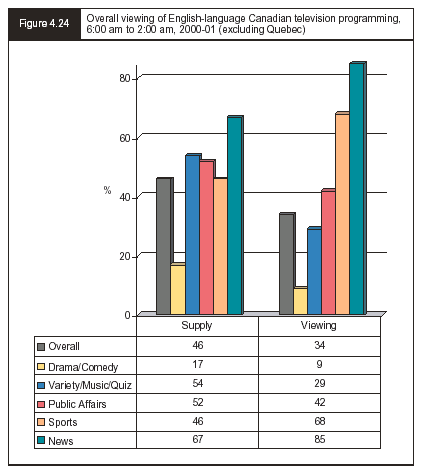
Three points concerning these data need to be made. First, only 34% of what anglophone Canadians watched in 2000-01 was Canadian content. Second, francophone Canadians watched a much higher proportion of Canadian content, almost 66%. Third, less than 10% of the drama watched by anglophones was Canadian, and surprisingly only 26% of the drama watched by francophones was Canadian.
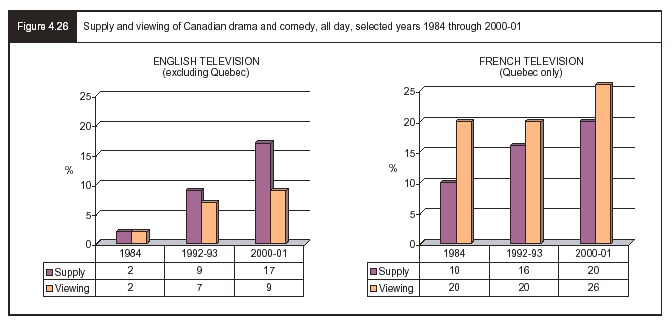
Although the situation described above might seem discouraging it does not show an important increase that occurred between 1984 and 2001. In 1984, 2% of the drama watched by English-speaking Canadians was made in Canada; by 1999, this had increased to 9%.19 This represents an improvement of more than 450%. Similarly the viewing of Canadian drama/comedy in the French-language market more than doubled from 10% to 26% during this same period.
One reason the viewing of English- and French-language drama/comedy has increased is because there is more programming available to watch. Due to improvements in program support measures (see Chapter 5), Canadian drama/comedy now represents 17% of the available English-language drama/comedy and 20% of all available French-language drama/comedy (see figure 4.24). In other words, the gap in the overall supply of English and French-language Canadian drama/comedy has narrowed significantly since 1984. The important difference, however, is that French-language Canadian drama/comedy now attracts a 26% audience share, whereas English-language Canadian drama/comedy attracts a 9% audience share. |
|
|
The giant of the small screen
Quebec television series are unique in the world of Canadian, if not international, television. In an installation prepared for the Téléroman exhibit at the Musée de la civilisation in Quebec City from 1996 to 1998, it was mentioned by way of introduction that, in 1974, UNESCO commissioned a Scandinavian sociologist, Tapio Varis, to prepare the first international survey of television programs. While doing this analysis, Varis realized that he had inventoried a significant number of hours of dramatic series in Quebec. This figure was so disproportionate in comparison with the rest of the world that he felt it necessary to specify that these figures were accurate and that there had been no error on his part. A better illustration of the situation is the fact that between 1953 and 1997, there were 168 major television series produced and broadcast in Quebec!
In addition to the sheer number of programs produced, there were audience ratings that broadcasters the world over can only dream of. The following ratings were recorded between 1962 and 1995:
• 2,686,000: Les belles histoires des pays d'en haut (1962)
• 2,689,000: Terre humaine (1981)
• 2,708,000: Rue des pignons (1975)
• 2,709,000: Moi et l'autre (1971)
• 2,717,000: Au nom du père et du fils (1993)
• 2,765,000: Entre chien et loup (1989)
• 3,008,000: Scoop (1994)
• 3,021,000: Le temps d'une paix (1986)
• 3,227,000: Lance et compte (1989)
• 3,334,000: Blanche (1993)
• 3,664,000: Les filles de Caleb (1991)
• 4,098,000: La petite vie (1995)
Obviously, underlying these ratings is a deep affection on the part of Quebec viewers for their own televised series. These ratings also reflect a dialogue, a very intimate communication between writers, actors and their viewers. There is a complicity that everyone identifies with. The popularity of television series in Quebec has remained unchanged for the past 50 years. Do television series reflect the heart and soul of Quebecers? Are they the cultural expression of their past and present aspirations, rivalled only by the songs of singer-songwriters?
Gilles Pelletier, who played various characters in these popular series, said :
[translation] ...television viewers enjoyed and continue to enjoy seeing the same characters week after week, characters they have come to regard as members of their family. Whether they are living dramatic and dangerous situations, as in Lance et compte, or recounting their daily disappointments and good fortune, as in Sous un ciel variable, viewers remain faithful. Why? Therein lies the secret of series that are made in Quebec. |
|
 |
|
To sum up, Canadian English-language television programming, taken as a whole, has not been as successful as its French-language counterpart in attracting viewers, particularly to Canadian drama and comedy. That said, both language groups have solid audiences for Canadian news and sports programming.
The Committee recognizes, however, that it must be cautious in its approach to the question of Canadian programming. One reason is that the problem may not be a lack of programming, but a lack of viewers. A second reason is that the problem is almost entirely in the area of English-language drama and comedy. The same problem does not exist with sports, children's programming or the news. Indeed, the Committee was told repeatedly during its hearings and its site visits that the range and quality of our children's programming is a Canadian success story.
For example, Mr. Alex Park, Vice-President, Programming and Educational Services, Shaw Children's Programming Initiative, told the Committee:
|
|
Incredible Story Studios, was voted the best children's program at the recent Gemini Awards, and was a silver medal winner in the New York International Children's Festival. This program, this Canadian program, is viewed in over 125 million homes in over 30 countries around the world. It is recognized as the most successful children's series sold in the international marketplace — one hundred per cent Canadian stories created by our Canadian children.20
Making a more general point, Mr. Richard Stursberg (who was at the time the Chairman of the Board of the Canadian Television Fund) said:
In many cases kids' programming, especially for very small children, is set in a non-specific environment that travels extremely well internationally. In fact, it's fair to say that Canadian kids' producers do very well internationally.21
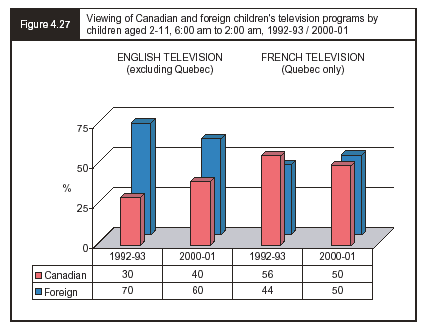
General support for these points about children's programming can be seen in figure 4.27. In 1992-93 about 30% of English Canadian children's viewing time was to Canadian programming. By 2000-01 this had increased to 40%. As for French-language programming, it can be seen that there was a 6% drop between 1992-93 and 2000-01, from 56% to 50%.
To sum up, it is worth noting that the most recent data for 2001-02 (see Chapter 5) show that there are thousands of new hours of Canadian programming being made available to watch each year. Excluding news and sports, more than 2,800 hours of original Canadian programming were created during the fiscal year 2001-02, an increase of nearly 400 hours from the previous year.22 Moreover, if one includes news and sports, there were several thousand additional hours of Canadian programming. This means that it is now possible for Canadians to watch just Canadian programming. As will be seen in Chapter 5, however, there is an ongoing challenge to support the creation and production of original Canadian programming.
Chapter 3 discussed various applications of nineteenth and twentieth century technologies that contributed to the emergence of today's broadcasting system. This section attempts to look forward to suggest the types of services that might be available to audiences. While no one knows the exact configuration of these services, glimmerings of the future can already be seen.
|
|
|
The Degrassi Phenomenon
Television for children and youth has long been one of the prides of Canadian production. And within that excellent output, one of the most successful English-language productions ever has been the Degrassi series.
The Degrassi series is now in its seventh incarnation. It began in 1986 on CBC as The Kids of Degrassi Street, which became Degrassi Junior High in 1987, then Degrassi High in 1989, as the series followed the lives of its growing characters. When the Kids finally grew into adults, the series culminated with the movie of the week, School's Out! and the non-fiction series on youth issues, Degrassi Talks. The show then returned in 2001 as Degrassi: the Next Generation on CTV, co-developed with the Internet site, www.degrassi.tv.
Degrassi.tv is more than an ordinary Web site. It's meant to look like the Web site of a real school — the one used by characters in the show. Users become "virtual students" at Degrassi Community School, with their own online home rooms, lockers and journals. They can compete in online games, message other users and the shows characters, and engage in discussion with kids from around the world. Moderators ensure that the Degrassi "rules" are adhered to, so that it's a safe online environment. Since the show itself raises real issues, the site is also set up to help kids find assistance for their more serious problems. Over 150,000 Canadians and another 30,000 Australians are currently registered users.
Perennially popular with young people in Canada and the more than 50 countries where it has been broadcast, the series has also won an impressive list of 38 awards for its actors and its originators, Linda Schuyler and Kit Hood, including 8 Gemini awards, 2 awards from the Prix Jeunesse, and 2 International Emmys.
The true accomplishment of the series is not measured by its awards, however, or even by such reviews as the New York Times' "a series that dispenses with tidy morality and goes for the gut". Its real service has been to the generations of young people for whom Degrassi has been a touchstone when dealing with the tremendous challenges they face.
Whether the series deals with high profile issues like drug and alcohol use, depression, the threat of AIDS, or just the day to day problems and joys of friendship, love and awakening sexuality, the issues dealt with on Degrassi have always been treated with realism and respect. In the words of creator/producer Linda Schuyler, "The goal of Degrassi is to say to young people who are going through that stage where they are part child, part adult, 'The kinds of feelings that you're experiencing, the changes that are happening in your body and your life, are happening to all sorts of kids, all over. You are not alone.'" |
|
 |
|
Changing habits
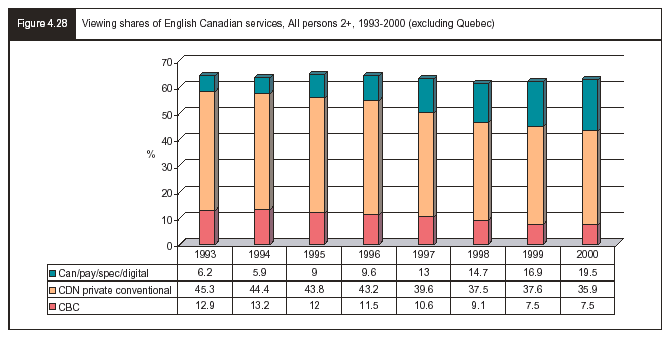
Figure 4.28 provides some perspective on how television viewing habits have changed in recent years. Using English television viewing data, this figure shows that there was a steady decline in the percentage of people who watched Canadian conventional television services between 1994 and 2001, and a concurrent increase in people watching Canadian specialty services. What this suggests is that viewing patterns are in transition and will likely continue to change as even more new media choices become available.
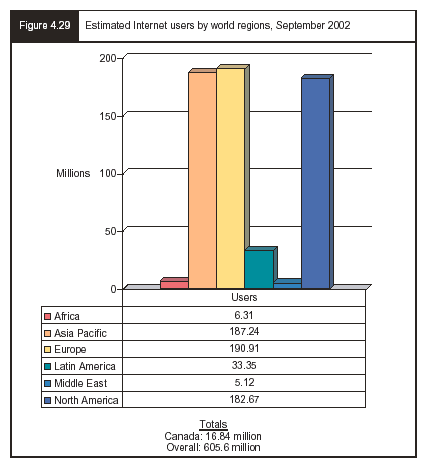
Perhaps of greater significance is the explosive growth in Internet use, not only in Canada, but worldwide over the past few years. Although estimating how many users are online is an inexact science, it is believed that more than 600 million people are now online. Figure 4.29 shows the
distribution of these online users by major regions. It is worth noting that virtually no one was online in 1991 and that most of this growth has occurred since the mid-1990s.
Within the Canadian context, Figure 4.30 shows that households with an Internet service provider (ISP) increased rapidly between the summer of 1997 and the fall of 2002.
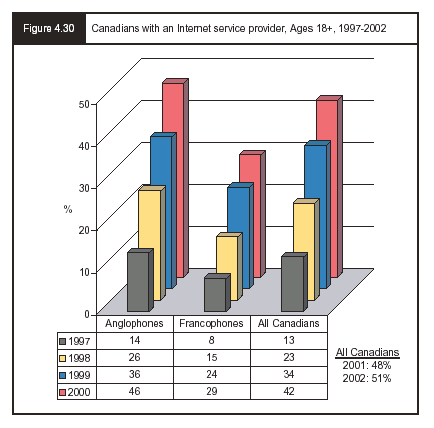
Statistics Canada further estimates that 4.7 million Canadian households in 2000 were connected to the Internet, of which 3.7 million (78%) were linked by telephone and 1 million (22%) were connected by cable (i.e., had high speed access). Moreover, over half of all Canadian households had at least one occupant who was a regular Internet user in 2000, which was an increase of 42% from 1999.23
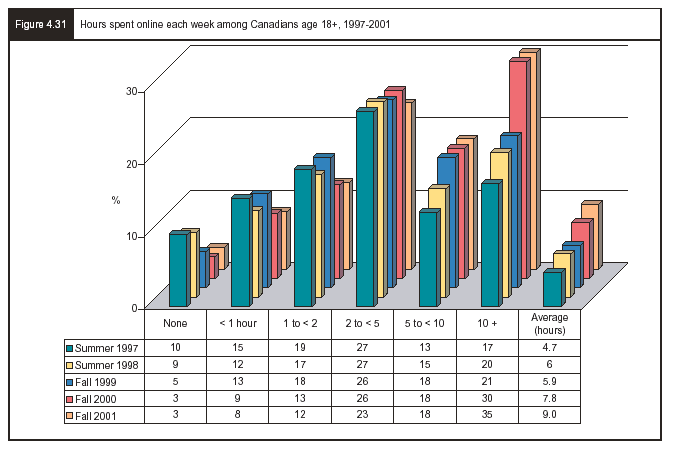
As for the amount of time spent online, figure 4.31 shows that between the summer of 1997 and the fall of 2000, Canadians increased their use of the Internet, from an average of 4.7 hours to 7.8 hours per week. Of particular interest is the fact that 35% of Canadians who use the Internet spent 10 hours or more per week online during the fall of 2001. |
 |
|
Trends to consider
While it is difficult to know with any precision how Canadians will decide to balance their use of the Internet and broadcasting, some interesting trends are evident if we look at the habits of today's youth. This section presents survey results from a study conducted by the Environics Research Group of 1,081 Canadian youth ages 6-16 in March 2000.
Figure 4.32 shows the time spent by Canadian youth watching television and using the Internet. As can be seen, more than 70% of all Canadian youth aged 6-16 in March 2000 reported using the Internet at school, and more than 80% reported using the Internet at home. As for television viewing, about 30% reported watching more than three hours a day and nearly 50% reported watching between one to three hours a day. Overall, more than 95% of all Canadian youth reported watching at least some television each day.
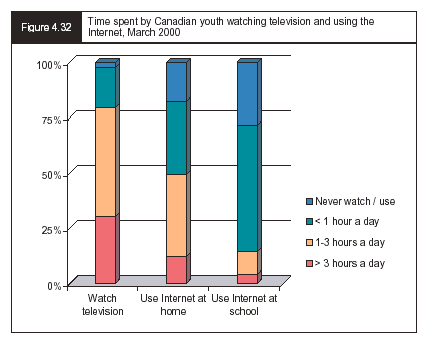
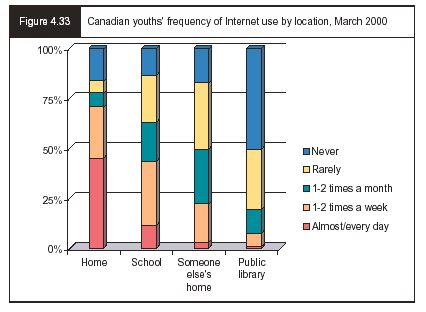
Figure 4.33 shows how often and where Canadian youth use the Internet. This figure reveals that more than 70% of all Canadian youth reported using the Internet at home at least once or twice a week in March 2000. Of those, a majority used it almost every day. It is interesting to note that
the use at home is more frequent than the use at school; that being said, more than 40% of all respondents also reported using the Internet at school at least once or twice a week.
Figure 4.34 shows the most common types of online activities engaged in by Canadian youth. Not surprisingly, the major reported uses were: downloading music, e-mail, surfing and games. It is also worth pointing out that more than 35% of the respondents said that they used the Internet for homework.
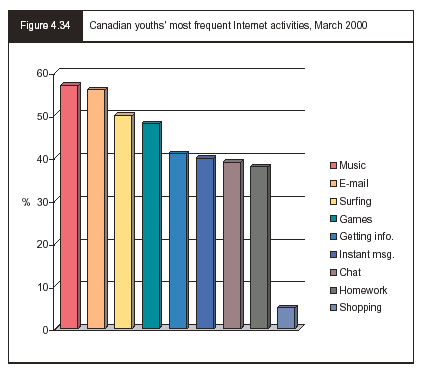
Figure 4.35 shows the types of information sought by Canadian youth when online. This figure shows that more than 35% of all Canadian youth reported seeking out Canadian information at least once a month. Moreover, more than 20% looked for health information at least once or twice a month.
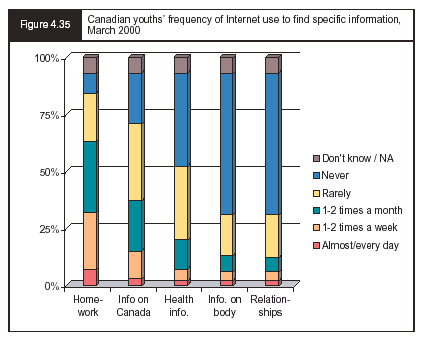
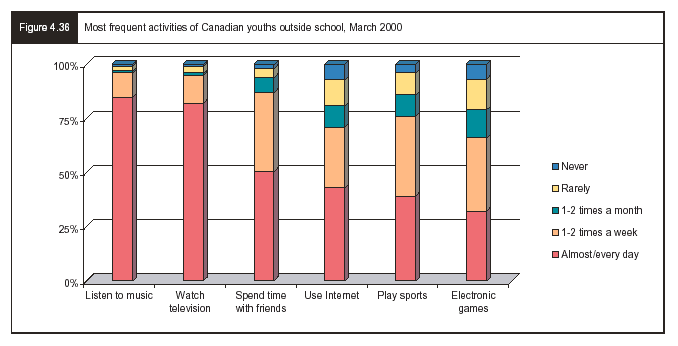
Figure 4.36 shows what Canada's youth reported doing outside of school in March 2000. As can be seen, more than 30% played electronic games, just under 40% played sports, more than 40% used the Internet, about 50% spent time with friends, more than 80% watch television and 85% listened to music. Clearly, Canadian youth engage in a number of activities each day.
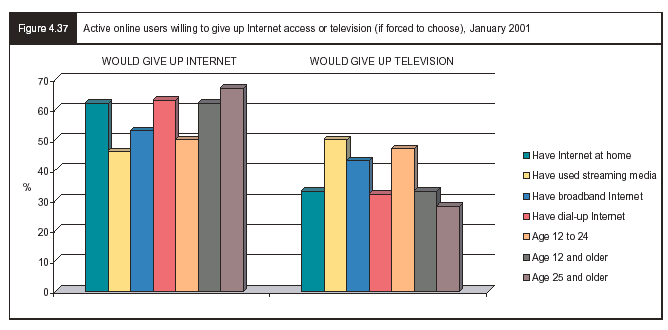
Not surprisingly, therefore, a January 2001 Edison Media Research study of American youth found that nearly 50% of all respondents reported that they sometimes watch television while online (see figure 4.37). Furthermore, when asked to choose between giving up television or giving up the Internet, just under 50% of those between 12 and 24 indicated that they would rather give up television.24
The importance of these findings should not be underestimated. Not only do they show that a significant portion of today's youth view the Internet as a more important communications medium than television, but they suggest that concurrent television and Internet use will be seen as commonplace in the years to come. |
 |
|
We also know that the demand for a technology that will interconnect all of the electronic equipment in the home is increasing.25 For example, in a recent survey of those with broadband Internet access, more than half wanted to make content accessible from any screen or speaker in the home, and specifically listed "digital video and recording and playback on any TV or computer as a demand for home networking." Furthermore, one-third wanted the ability to listen to streaming audio, or to watch streaming Internet video on their terms, on devices of their choosing.26
What do we do online?
It is important to realize that the Internet is used for a number of different purposes. For example, in December 2002, approximately 350,000 terabytes of information (that is, about 1,000 terabytes per day) were transmitted via the Internet.27 A terabyte is 1,000 gigabytes or a trillion bytes. Since it is difficult to conceive of a trillion bytes as "bytes" it is helpful to imagine a trillion bytes as being the equivalent of 300 years of a fairly thick daily newspaper (e.g., La Presse, The Toronto Star, the New York Times), or two terabytes as the size of an academic research library.
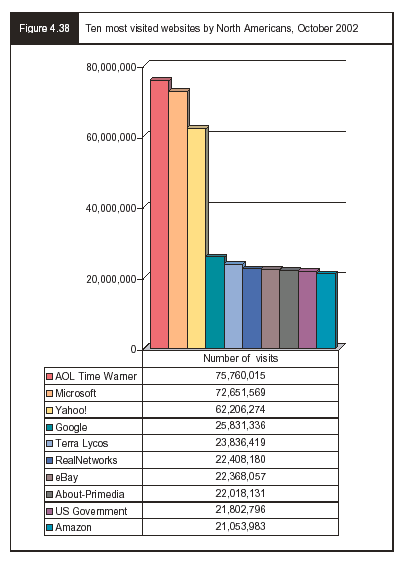
While it is hard to separate use of the Internet by individuals,28 it is possible to look at the traffic on the Internet that does not involve "data".29 One way to get a sense of how individuals use the Internet is to look at the top destinations on the Internet (i.e., the top 10 sites visited). According to Nielsen/Net Ratings, the top 25 sites visited by North Americans in October 2002 ranged from AOL Time Warner (number 1) to iVillage (number 25). Of these top 25 sites, the top 10 sites are listed in figure 4.38.
The average amount of time spent on these sites varied from 6 hours for AOL Time Warner to almost 14 minutes for Amazon. Knowing the type of site gives some indication of why people might be visiting the site. Amazon, for example, sells books and music, eBay is an auction site, Microsoft sells software and needed updates, and Google is a search engine. At least 4 of the top 25 sites visited are search engines — Google, Terra Lycos, Classmates, and Ask Jeeves. Several others might also be thought of as specialized search engines, providing information on specific topics (e.g., Earthlink, iVillage and the InfoSpace Network).
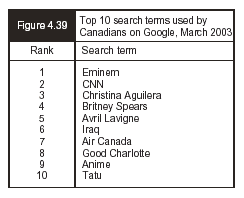
It is also possible to obtain a sense of what people use the Internet for by looking at the keywords used in searches for information. By way of example, the top 10 search terms used by Canadians on Google in March 2003 are listed in figure 4.39.
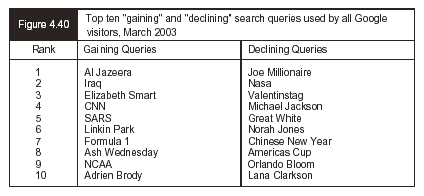
Google also reports regularly on the top 20 "gaining" and "declining" search queries used by the full population of online users who visit its service. Figure 4.40 shows the results for March 2003.30
From figures 4.39 and 4.40 it can be seen that individuals tend to use the Internet for information on subjects of interest to them; that is, news, games, music, film, television and sports. But the top searches only tell us what is most popular. Other studies show that people's use of the Internet is more serious than a quick search for sports scores or pictures of favourite pop star. The Internet, for example, is also an important source of information about government, medicine, the environment and real estate. Moreover, in July 2000, it was estimated that 30 million Americans were averaging "83.2 hours a year looking for political information on the Internet."31
In short, it can be seen from the above discussion that individuals use the Internet for a broad range of purposes. Among other things, these include information on the weather, sports, popular entertainment and government services.
As noted in Chapter 3, the broad implications of changes in audience habits and preferences on the current broadcasting system in Canada are not difficult to see. Audiences will continue to fragment and competition will be more intense than it has been in the past. As the number of programs increase, the importance of marketing and program placement will increase. Encouraging interest in a program when it is competing against four other programs is one challenge, but attracting attention to a program competing against 350 or more programs is more difficult.
While audience fragmentation sounds new, it is not. Similar periods of change have swept through other media. Perhaps the best example is the magazine industry. During the 1950s, a few popular magazines enjoyed large audiences and were read in a majority of North American households. The most popular American magazines were Life, Look, The Saturday Evening Post, and Liberty. Popular Canadian magazines of the 1950s included Saturday Night, Maclean's, La revue populaire, Le samedi and newspaper inserts such as The Star Weekly. Almost all of these titles have disappeared, changed their approach, or only appear in commemorative editions on special occasions.
While some might lament the passing of these titles, there are many more magazine titles available in 2002 than at any time in the 1950s. General
purpose magazines have mostly disappeared to be replaced by special purpose magazines dealing with subjects such as kayaking, home furnishings, fly-fishing and business. Those general purpose magazines (for example, Chatelaine) that have survived have in their own way become special interest magazines (i.e., focusing on the interests of a particular target group).
A similar process has occurred in book publishing. There have been many more new titles published during the last decade (1990 to 2000) than in any decade in the 500 years since the invention of the printing press. This has offered more choice for readers and a set of headaches for those who print and sell books, as it is much harder to keep track of hundreds of thousands of titles than a few thousand. The increase in the number of titles has also increased the importance of marketing and promotion campaigns. After all, if there are several hundred thousand titles in a bookstore, how is a potential reader going to find out about a particular book?
In short, technologies that were developed for other purposes have changed magazines and books, and now broadcasting. Sending information along a thin glass fibre was originally used to inspect machinery and in medicine; now this practice appears set to change the way we think about broadcasting and, by extension, the very nature of how Canadians will communicate in the years to come.
While the many challenges facing the Canadian broadcasting system may seem daunting, it is worthwhile remembering that Canadians, despite the ever-present cultural pressure and influence of the United States, have created a broadcasting system that covers the entire country, offers a great deal of choice and has produced successes in English and French in news, sports, children's programming, music, variety and public affairs.
Inexorably, the system is moving from "broadcasting" to "narrowcasting" or even to something resembling "unicasting." Renting a video might be thought of as a physical model of "unicasting." One person decides what to watch and then makes a set of arrangements (goes to the store, rents a video and so on) to do so. It is now possible to "subscribe" to a newspaper and "design" the newspaper to your specifications. Similarly, it is already possible to "subscribe" to services that provide music, movies or television shows at a time that is convenient to you. This is not unlike the model that is already in place for video-on-demand, television programming for movies and special events.32
The challenge, therefore, is to build on these successes, address problem areas and create the conditions for greater success in the coming decades, during which there will be a level of change in communications unlike anything Canadians have ever witnessed.
Endnotes
| 1 | Streaming video and audio can be defined as a means of starting to play a message while the rest of it is being copied. Streaming uses compression to make voice, video and data smaller so that it can be transmitted in less time. Streaming video and audio are used to broadcast video and audio over the Internet. |
| 2 | The categories used by the CRTC for various Canadian content requirements are as follows: news, public affairs, sports, drama comedy (includes movies), variety, other. |
| 3 | "Coverage" is also used interchangeably with "reach" (i.e., to describe the extent of a medium in reaching a group of people). In this report "coverage" describes the geographic extent of a medium. |
| 9 | Canadian Film and Television Production Association, Profile 2003: An Economic Report on the Canadian Film and Television Industry, February 2003. |
| 11 | Data concerning CBC radio stations are provided in Chapter 6. |
| 12 | Appendix 17 provides data sources for all figures in this report. |
| 13 | The people meter has a built-in technique to ask for a response from the viewer if the channel has not been changed in the last hour but it still is prone to over-estimate the length of time people have been watching television. |
| 15 | CBC Research (broadcast year September to August data); CRTC Data. |
| 16 | Neilsen Media Research. Estimates for January 2003. |
| 17 | CBC Research, Shedding New Light on Viewing to Canadian Programming, 31 May 2002. |
| 18 | Meeting of the Standing Committee on Canadian Heritage, 22 November 2001. |
| 19 | Canadian Media Research Inc, Trends in Canadians use of TV. Prepared for the Canadian Film and Television Production Association, August 2001. The report is based on Statistics Canada data. |
| 20 | Meeting of the Standing Committee on Canadian Heritage, 27 November 2001. |
| 22 | Canadian Film and Television Production Association, Profile 2003, p. 28. |
| 25 | Press Release, 5 January 2001, "Ucentric Systems Announces Key Application Partnerships for Home Networking," www.ucentric.com . |
| 27 | "Internet Traffic Tops 350,000 Terabytes Per Month," Cambridge Telecom Report, 24 January 2003. |
| 28 | It is also difficult to separate traffic specific to Canada from North American traffic. This is not an insurmountable problem since Canadian's use of the Internet is not much different than other people's use of the Internet (e.g., in Europe, the United States or Australia). |
| 29 | Approximately half of all Internet traffic is data (e.g., financial information sent between institutions, the geographic location of vehicles on the highways and the results of experiments being shared among researchers). These data exchanges usually take place among people working for institutions (hospitals, universities, companies) and can be set aside for the time being. |
| 30 | "Gaining" refers to the most common search requests submitted by online users during a given period; "declining" represents search requests that are receiving fewer search requests than an earlier measurement period. |
| 32 | The disadvantage of unicasting is that each client receives a separate data stream, thereby rapidly consuming network bandwidth. |
| |
|
|


