FAIT Committee Report
If you have any questions or comments regarding the accessibility of this publication, please contact us at accessible@parl.gc.ca.
A. Trade Between Canada and Asia-Pacific
With the exception of its NAFTA partners, Canada trades more with the countries in the Asia-Pacific region than any other major region in the world. Total merchandise trade between Canada and Asia-Pacific countries was valued at $74 billion in 2002, accounting for about 45% of its merchandise trade outside the NAFTA region. Canadian exports to Asia-Pacific make up $21 billion of that total while imports account for the remaining $53 billion.
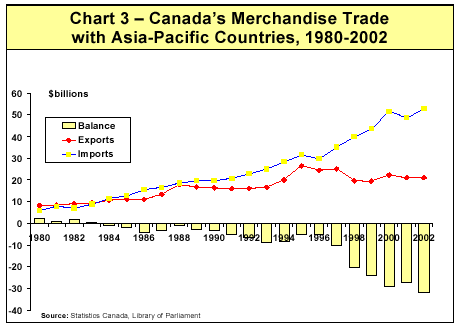
Although the distribution of exports and imports suggests that Canada holds a substantial trade deficit with Asia-Pacific, this was not always the case. In the early 1980s, Canada held a small trade surplus with countries in the Asia-Pacific region. Since that time, however, imports from Asia-Pacific have grown much more rapidly than have exports to that region. From 1980 to 1996 Canadian exports to Asia-Pacific increased by an average of 7.0% annually. By comparison, imports from Asia grew by 10.5% over that same period.
This growing trade imbalance was exacerbated by the Asian Financial Crisis in 1997. As much of the region slid into recession and local currencies tumbled, it became very difficult for Canadian exporters to continue to sell in most Asian markets. Some exporters were effectively priced out of many Asian markets by the exchange rate effects of the crisis, while others found that the impact of the recession in the region eroded demand for their products. Merchandise exports to Asia-Pacific fell by 22% from 1997 to 1998 and have yet to recover their pre-1998 value.
At the same time, however, the decline in the value of Asian currencies made their goods even more competitive abroad. While Canadian exports to the region fell, import growth continued unabated. As a result, Canada’s trade deficit with Asia-Pacific has ballooned since 1997, rising from $10 billion that year to $32 billion by 2002.
(a) Canadian Merchandise Export Markets in Asia-Pacific
Canada’s merchandise exports to Asia-Pacific are dominated by a handful of key markets, primarily in Asia. Countries in Oceania — most notably Australia and New Zealand — only account for about 5% of Canada’s merchandise trade to the region as a whole. Canada’s most significant export destinations are Japan and China which together account for nearly three-fifths of Canada’s total exports to the region. With merchandise sales valued at $8.2 billion in 2002, Japan is Canada’s largest export destination in Asia-Pacific and second-largest in the world. For its part, China is Canada’s fourth-largest export destination worldwide, with merchandise exports to that country exceeding $4.0 billion in 2002.
Although Japan and China are Canada’s two largest customers in Asia-Pacific, the evolution of exports to those countries are headed in opposite directions. Canadian exports to Japan experienced strong growth through the 1980s and into first half of the 1990s. However, the combination of the Asian Crisis and Japan’s ongoing internal economic difficulties have dampened Japanese appetite for Canadian imports.22 After rising by 47% in the first half of the 1990s, merchandise exports to Japan peaked at $12.1 billion in 1995 and have since fallen by over 30%.
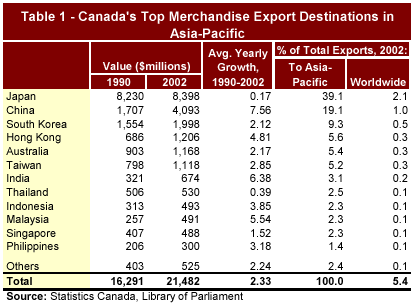
By contrast, export growth to China has been brisk, particularly in the recent past. As China continues with market-based economic reforms, access to the Chinese market has improved for foreign suppliers, including Canada. Since 1997, Canadian exports to China have increased by 67%.
Aside from Japan and China, other major export destinations in Asia-Pacific include South Korea, Hong Kong, Australia and Taiwan. Of these, South Korea is the most significant. Canada exported about $2.0 billion in merchandise to South Korea in 2002 — about 9% of Canada’s total exports to Asia-Pacific. Export totals for the other three countries are all between $1.1 and $1.2 billion dollars. Each accounts for slightly more than 5% of Canada’s total exports to Asia-Pacific.
As noted for Japan above, 2002 export levels to South Korea, Hong Kong and Taiwan are well below their record levels set in the mid-1990s, immediately prior to the Asian Crisis. In particular, exports to South Korea have fallen dramatically — by 30% from 1996 to 2002. For its part, export growth to Australia has been more solid. All together, these four countries, along with China and Japan, account for about 84% of Canada’s total exports to the Asia-Pacific region.
Although Canada’s exports to most Asian countries have been stagnant in recent years and have yet to regain their pre-1997 levels, there are a few noteworthy exceptions. In addition to China where Canadian exporters are having some success, India and Vietnam are emerging as potentially significant markets. The total value of exports to those two countries remains relatively modest, but is growing rapidly in both cases.
British Columbia (BC) is by far Canada’s largest exporting province to Asia-Pacific. In 2002, BC shipped goods valued at $6.9 billion to that part of the world, making up nearly one-third of Canada’s total exports to the region that year. Although BC dominates Canada’s trade with Asia-Pacific, its exports to that region have been hit hard since the mid-1990s. Japan is a dominant export market for BC and the poor performance of the Japanese economy through much of the 1990s took a toll on BC’s overall exports to Asia-Pacific. Exports to the region have fallen by 33% from their peak of $10.3 billion in 1995.
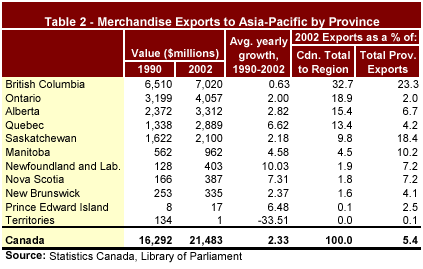
Ontario and Alberta are the next largest exporters, selling $4.0 billion and $3.3 billion in merchandise to the Asia-Pacific region in 2002, respectively, accounting for about 19% and 16% of Canada’s total trade to Asia-Pacific that year. While Alberta’s exports to Asia-Pacific are primarily directed to Japan and to a lesser extent China, Ontario’s exports to the region are relatively well-distributed. China and Japan are Ontario’s largest export destinations as well, but Australia and Hong Kong are also important markets, each accounting for about 12% of Ontario’s exports to the region.
Quebec and Saskatchewan are also significant exporters to Asia-Pacific, accounting for 13.8% and 9.8% of Canada’s total merchandise exports to that region, respectively. With the exception of Newfoundland and Labrador, Quebec is the only province whose exports to Asia-Pacific in 2002 surpassed their pre-Asian Crisis value.
Although BC and Ontario are the two largest exporters to Asia-Pacific by dollar value, this fact does not necessarily reflect the importance of that region to the provincial economies. In BC, Asia-Pacific is a critical export market, accounting for over 23% of provincial exports worldwide. By contrast, Ontario’s exports are heavily concentrated in the U.S., making the Asia-Pacific market comparatively insignificant. Less than 2% of Ontario’s 2002 merchandise exports went to countries in Asia-Pacific. In general, Asia-Pacific is a more important export destination for western provinces than for those in the east. BC, Saskatchewan and Manitoba send the greatest proportion of total provincial exports to Asia-Pacific countries.
Table 3 provides an overview of Canada’s major export products to Asia-Pacific. While forest products — wood and wood products, pulp and paper — are the largest category of exports to the region, Canada in fact sells a wide range of goods in Asia-Pacific. Resource-based products, including agricultural commodities, minerals and fossil fuels account for over half of Canada’s shipments to the region, but high-tech manufactured goods are also significant exports.
The composition of Canada’s exports to Asia-Pacific has changed considerably since the early 1990s. Meat and meat products, telecommunications equipment and motor vehicles have emerged as significant export goods. At the same time, there has been a decline in shipments of cereal grains, plastics and fossil fuels.
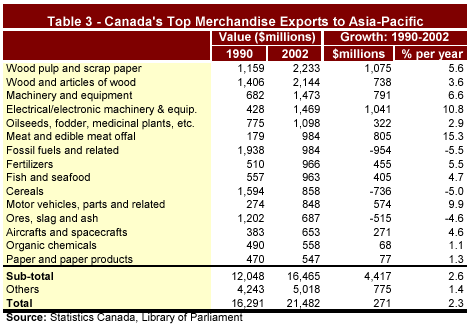
Although all provinces export a broad array of goods to Asia-Pacific, the mix of products depends considerably on the region of origin. The Atlantic provinces export primarily fish, seafood, forest products and mineral ores. Ontario and Quebec also export forest and mineral products, as well as some agricultural products. However, the region’s primary exports to Asia-Pacific are manufactured goods such as aerospace and motor vehicles, machinery and equipment, and electronics. The prairie provinces, for their part, are significant exporters of grains, meats, oilseeds and other agricultural products, in addition to fertilizers, other chemicals, fossil fuels and some electronics. Finally, BC exports a significant quantity of forest products to Asia-Pacific, as well as mineral products, fossil fuels and some manufactured goods.
(b) Canadian Merchandise Imports from Asia
Canada’s largest export destinations, China and Japan are also the most significant sources of imports into Canada from Asia-Pacific. Those two countries each account for about 30% of Canadian imports from the region. China is Canada’s largest single source of imports from Asia-Pacific and second-largest source of imports worldwide, behind only the United States. Total sales from China to Canada were valued at $16.0 billion in 2002. Imports from Japan — Canada’s third-largest source of imports worldwide — were only slightly lower, at $15.4 billion.
China’s emergence as a major source of Canadian imports has been remarkable. In 1990, China was Canada’s eleventh-largest source of imports, with sales valued at $1.4 billion. Since that time, however, Chinese exports to Canada have soared, growing by an average rate of 22.5% per year. For its part, Japan’s exports to Canada have also been growing, albeit at a much lower rate than imports from China. Japan had been Canada’s second-largest source of imports until 2002.
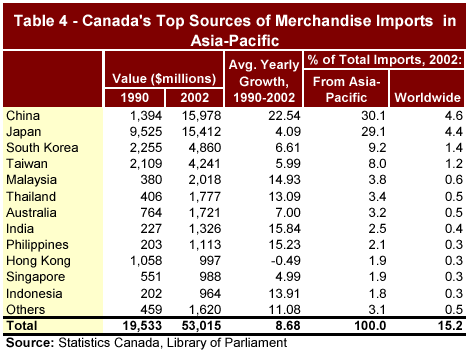
South Korea and Taiwan are also notable sources of imports into Canada. In both cases, imports grew strongly throughout the 1990s but have tapered off somewhat in the current decade. Imports from those two countries were valued at $4.9 billion and $4.2 billion in 2002, respectively, accounting for 9.2% and 8.0% of total imports from Asia-Pacific into Canada that year.
Although the above-mentioned four countries account for over three-quarters of all Canadian imports from Asia-Pacific, a number of smaller countries are rapidly emerging as significant exporters into Canada. Malaysia, Thailand, India, Vietnam and the Philippines have all made considerable gains in the Canadian market since the early 1990s.
Canadian imports from Asia-Pacific are a mix of sophisticated high-tech goods and labour-intensive, low-value-added products. High-tech goods dominate, however, led by automobiles and auto parts, computers, electronics and telecommunications equipment. Together, electronics, machinery and equipment, and motor vehicles and parts made up over half of all shipments from Asia-Pacific countries in 2002.
However, high-tech goods are not the only products from Asia-Pacific entering the Canadian market. The clothing, apparel and other related industries in the region are also significant exporters into Canada, as are manufacturers of toys and games, iron and steel products, rubber and plastics. The recent strong growth in imports into Canada from Asia-Pacific countries is distributed across a wide range of products and product types. Electronics, furniture, knitted clothing and plastics have all made considerable gains in Canada over the 1990s.
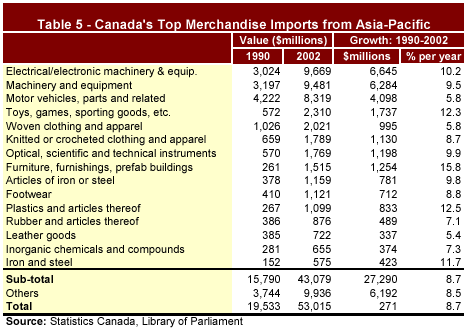
With a few exceptions, Canadian imports from its major Asia-Pacific sources do not vary considerably from country to country. In general, most of Canada’s major trading partners in the region sell a mixture of high-tech and labour-intensive goods. The most notable exception to this rule is Japan. Notwithstanding its recent economic difficulties, Japan remains the wealthiest
country in the region and trades almost exclusively in high-value goods. Not surprisingly, Japan is the dominant source of Canadian automobile imports from the region.
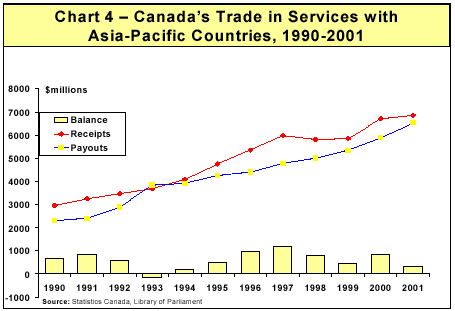
Although Canada’s economic relationship with Asia-Pacific is dominated by the exchange of merchandise, trade in services is an increasingly significant component of that relationship. These services include travel, transportation services, government services, and commercial services such as consulting, financial services, construction, computer and information services. In 2001, the most recent year for which data is available, Canada and Asia-Pacific exchanged services valued at a total of $13.4 billion. Asia-Pacific countries purchased $6.8 billion in Canadian services while Canada paid out $6.5 billion for services from the region. Canada holds a small trade surplus in services of about $300 million.
In terms of percentage shares, Asia-Pacific is a more significant market for the service sector than it is for merchandise products. The United States and Europe are Canada’s primary and secondary destinations for service exports, but Canada’s service exports to Asia-Pacific accounted for about 11.6% of its total service exports worldwide in 2001. By contrast, only 5.2% of Canada’s merchandise exports went to Asia-Pacific that year.
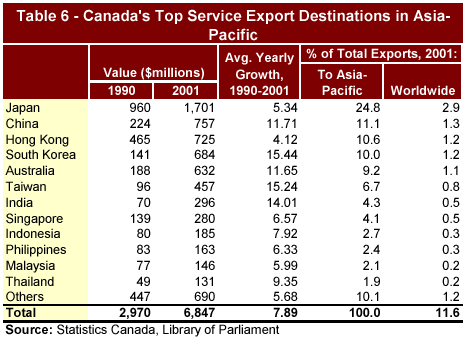
Services exports to Asia-Pacific are also growing more rapidly than merchandise exports. Valued at just under $3.0 billion in 1990, service exports to Asia-Pacific rose by an average of 7.9% per year from 1990 to 2001. By comparison, merchandise exports grew by an average of only 2.4% over that same period. As a result, services are increasing in importance as a component of Canada’s total exports to Asia-Pacific. In 1990, service exports were equivalent to about 18.2% of Canada’s merchandise exports. By 2001, that had risen to about 32.4%.
Canadian service exports to Asia-Pacific are more evenly distributed across the region as compared to merchandise exports. At $1.7 billion in 2001, Japan is by far the largest purchaser of Canadian services, accounting for about 25.6% of Canada’s total service exports to Asia-Pacific. Japan is also the third largest destination of Canadian services worldwide, behind the United States and the United Kingdom. However, five other countries and economic regions are also significant buyers of Canadian services. Hong Kong, China, South Korea, Australia and Taiwan all account for between 8% and 12% of total Canadian service exports to the region. The latter three, along with Vietnam, have seen the most rapid growth in Canadian service exports since 1990.
On the import side, Asia-Pacific is somewhat less significant to Canada as a source of services as it is a source of goods. The region accounts for about 9.7% of Canada’s total purchase of services worldwide, compared to 14.2% of Canada’s total merchandise imports. Canadian imports of Asian services are increasing slightly more rapidly than growth in merchandise imports. From $2.3 billion in 1990, service imports from Asia-Pacific grew at an average rate of 9.9% annually to the year 2001, compared to an average rate of growth of 8.6% for merchandise imports over the same period.
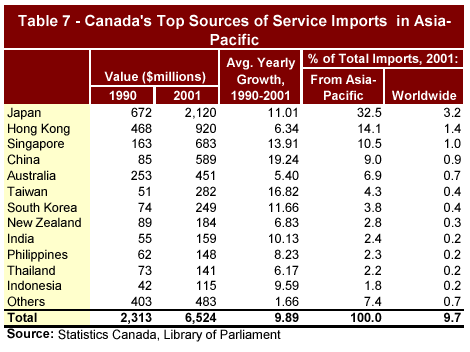
Compared to Canada’s distribution of service exports, its sources of imports are somewhat more concentrated in a few key countries. Japan is Canada’s largest source of service imports in Asia-Pacific and, as with service exports, the third largest worldwide behind the United States and the United Kingdom. In 2001, Canada purchased just under $2.1 billion in services from Japan, accounting for about 32.5% of total service payouts in Asia-Pacific. Other significant sources of imports include Hong Kong, Singapore, China and Australia. Along with Japan, these five economies account for three-quarters of Canada’s service imports from Asia-Pacific. Emerging, rapidly-growing service exporters to Canada include Indonesia, Malaysia, India and Vietnam.
Foreign direct investment is a significant indicator, not only of the current economic relationship between Canada and Asia-Pacific, but of the direction of the future relationship as well. As John Banigan (Assistant Deputy Minister, Industry sector, Department of Industry) reminded the Sub-Committee, FDI acts as a catalyst for international trade. The interaction between parent companies and subsidiaries forges potential trade linkages and creates markets for goods and services.
Japan is Canada’s largest destination for foreign direct investment in Asia-Pacific and ninth-largest in the world. Canadian FDI in Japan totalled $9.2 billion in 2002, accounting for a quarter of Canada’s total foreign investment in Asia-Pacific. Although Canadian exports to Japan have been stagnant since the Asian Crisis, Japan has remained an attractive environment for Canadian investors. Since 1997, Canadian FDI in Japan has more than doubled while merchandise exports have fallen by more than 25%.
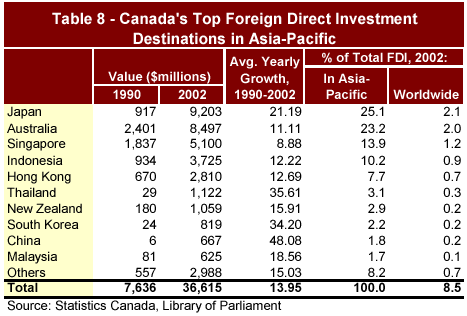
Other significant destinations for Canadian FDI in Asia-Pacific include Hong Kong, Singapore, Australia and Indonesia. However, some of the most rapid growth in investment has been in China, South Korea and a number of Southeast Asian countries, most notably Thailand and Malaysia.
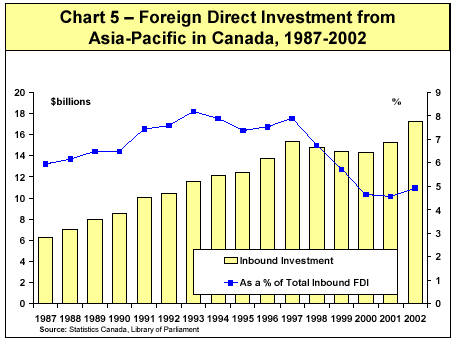
Only a handful of Asia-Pacific countries have significant investments in Canada. Japan, Hong Kong and Australia together account for 91% of all Canadian inbound FDI from the region in 2002. Of these, Japan is by far the largest investor in Canada. Primarily concentrated in the automotive sector, FDI from Japan totalled $8.6 billion in 2002, making up half of all Asia-Pacific investment in Canada.
| 22 | However, total imports into Japan have remained strong throughout this period. |