Start of content

ERRE Committee Report

If you have any questions or comments regarding the accessibility of this publication, please contact us at accessible@parl.gc.ca.

PDF

APPENDIX F : E-CONSULTATION ON ELECTORAL REFORM, SUMMARY OF RESPONSES

RESPONDENT IDENTIFICATION

Table 1: Provinces/Territories

Province/Territory

Count

Percentage of respondents (%)

Percentage of the Canadian population (%)[1]

Alberta

3199

14.4

11.7

British Columbia

5933

26.7

13.1

Manitoba

744

3.3

3.6

Nova Scotia

567

2.5

2.6

New Brunswick

325

1.5

2.1

Newfoundland and Labrador

115

0.5

1.5

Ontario

8615

38.7

38.5

Prince Edward Island

83

0.4

0.4

Quebec

1676

7.5

22.9

Saskatchewan

668

3.0

3.2

Northwest Territories

37

0.2

0.1

Nunavut

5

0.0

0.1

Yukon

120

0.5

0.1

Currently living abroad

161

0.7

N/A

Table 2: Gender

Gender

Count

Percentage of respondents (%)

Percentage of the Canadian population (%)[2]

Female

7281

32.7

51.4

Male

14580

65.5

49.6

Transgender

88

0.4

N/A

Other/Not specified

299

1.3

N/A

Figure 1: Gender

Figure 1: Gender

Table 3: Age Group

Age Group

Count

Percentage of respondents (%)

Percentage of the Canadian population (%)[3]

17 and under

188

0.8

N/A

18-24

1379

6.2

N/A

25-34

4229

19

13.9

35-44

3156

14.2

13.3

45-54

2830

12.7

14.2

55-64

4242

19.1

13.6

65-74

4652

20.9

9.2

75 and over

1572

7.1

7.2

Figure 2: Age Group

Figure 2: Age Group

Table 4: Primary official language

Official language

Count

Percentage of respondents (%)

English

19786

88.9

French

1072

4.8

Bilingual

1390

6.2

Figure 3: Primary official language (%)

Figure 3: Primary official language (%)

Table 5: Unique status

Status

Count

Percentage of respondents (%)

Percentage of the Canadian population (%)

Indigenous

706

3.2

4.3[4]

Individual with a disability

1441

6.5

13.7[5]

New Canadian

784

3.5

N/A

A resident of a rural of remote community

3787

17.0

19.0[6]

Not answered

15952

71.7

N/A

Table 6: Canadian Citizenship

Citizenship

Count

Percent answer (%)

Yes

22108

99.4

No

140

0.6

Table 7: Did you vote in the last federal election?

Vote

Count

Percent answer of respondents (%)

Percentage of Eligible Voters, 42nd General Election (October 2015) (%)[7]

Yes

21355

96.0

68.0

No

893

4.0

32.0

YOUR VOTE

Table 8: Did you vote in federal elections?

Frequency of voting

Count

Percent answer (%)

On every occasion that I have been eligible to vote

20921

95.4

Sometimes

906

4.1

No

94

0.4

Table 9: When you vote, do you feel that your vote “counts”?

Answer

Count

Percent answer (%)

Yes

11425

52.3

No

10402

47.7

Figure 4: When you vote, do you feel that your vote “counts”?

Figure 4: When you vote, do you feel that your vote “counts”?

Table 10: When you have voted, what motivated you to cast your ballot?

Source of motivation

Count

Civic duty

17216

Support for a local candidate

11288

Support for a party policy/platform

16403

Opposition to party policy/platform

11948

Support for a political party

11765

Opposition to a political party

10387

Support for a political party leader

9855

Opposition to a political party leader

10198

Other

1037

Figure 5: When you have voted, what motivated you to cast your ballot?

Figure 5: When you have voted, what motivated you to cast your ballot?

Table 11: When you have not voted, what has been the reason?

Reason

Count

Lack of time / Other responsibilities

249

Did not know where to vote

57

Unable to access polling station because of physical barriers

30

Unable to access polling station because of distant barriers

72

Unable to access polling station because of lack of transportation

34

Not aware that it was election day

38

Not interested

185

Felt that my vote would not count / would not impact the outcome

516

Did not support any candidates running in my riding

297

Unable to register to vote and/or provide sufficient identification and/or proof of address

60

Lack of confidence in candidates and / or parties and/or leaders

468

Other

219

Figure 6: When you have not voted, what has been the reason?

Figure 6: When you have not voted, what has been the reason?

GOALS OF A VOTING SYSTEM

Table 12: How important are each of the following elements to you? Scale: 1 (Not important) – 5 (Very important)

Elements

Count and percent answers

1

2

3

4

5

To know your local representative

877 (3.9%)

1747 (7.9%)

4984 (22.4%)

6743 (30.3%)

7897 (35.5%)

To be affiliated with a political party

5384 (24.2%)

4382 (19.7%)

5817 (26.1%)

3515 (15.8%)

3150 (14.2%)

To be aware of political party platforms

122 (0.5%)

125 (0.6%)

725 (3.3%)

4005 (18.0%)

17271 (77.6%)

Figure 7: How important is it for you to know your local representative? Scale: 1 (Not important) – 5 (Very important)

Figure 7: How important is it for you to know your local representative? Scale: 1 (Not important) – 5 (Very important)

Figure 8: How important is it for you to be affiliated with a political party? Scale: 1 (Not important) – 5 (Very important)

Figure 8: How important is it for you to be affiliated with a political party? Scale: 1 (Not important) – 5 (Very important)

Figure 9: How important is it for you to be aware of political party platforms Scale: 1 (Not important) – 5 (Very important)

Figure 9: How important is it for you to be aware of political party platforms Scale: 1 (Not important) – 5 (Very important)

Table 13: One political party should hold a majority of seats in Parliament Scale: 1 (Strongly Disagree) – 5 (Strongly Agree); NA

Statement

Count and percent answers

1

2

3

4

5

NA

Canada's electoral system should favour the following outcome: one political party holds a majority of seats in Parliament and is able to implement its campaign platform

7166 (32.3%)

4073 (18.3%)

3751 (16.9%)

2630 (11.8%)

3999 (18.0%)

629 (2.8%)

Figure 10: One political party should hold a majority of seats in Parliament Scale: 1 (Strongly Disagree) – 5 (Strongly Agree); NA

Figure 10: One political party should hold a majority of seats in Parliament Scale: 1 (Strongly Disagree) – 5 (Strongly Agree); NA

Table 14: No single political party should hold the majority of seats in Parliament, increasing the likelihood of political parties working together to pass legislation Scale: 1 (Strongly Disagree) – 5 (Strongly Agree); NA

Statement

Count and percent answers

1

2

3

4

5

NA

Canada's electoral system should favour the following outcome: no single political party holds the majority of seats in Parliament, thereby increasing the likelihood that political parties will work together to pass legislation

3907 (17.6%)

2257 (10.1%)

3348 (15.0%)

4820 (21.7%)

7067 (31.8%)

849 (3.8%)

Figure 11: No single political party should hold the majority of seats in Parliament, increasing the likelihood of political parties working together to pass legislation Scale: 1 (Strongly Disagree) – 5 (Strongly Agree); NA

Figure 11: No single political party should hold the majority of seats in Parliament, increasing the likelihood of political parties working together to pass legislation Scale: 1 (Strongly Disagree) – 5 (Strongly Agree); NA

Table 15: Voters should elect local candidates to represent them in Parliament Scale: 1 (Strongly Disagree) – 5 (Strongly Agree); NA

Statement

Count and percent answers

1

2

3

4

5

NA

Canada's electoral system should ensure that voters elect local candidates to represent them in Parliament

636 (2.9%)

1117 (5.0%)

3516 (15.8%)

5323 (23.9%)

10808 (48.6%)

848 (3.8%)

Figure 12: Voters should elect local candidates to represent them in Parliament Scale: 1 (Strongly Disagree) – 5 (Strongly Agree); NA

Figure 12: Voters should elect local candidates to represent them in Parliament Scale: 1 (Strongly Disagree) – 5 (Strongly Agree); NA

Table 16: Number of seats held by a party in Parliament should reflect the proportion of votes it received across the country Scale: 1 (Strongly Disagree) – 5 (Strongly Agree); NA

Statement

Count and percent answers


1

2

3

4

5

NA

Canada's electoral system should ensure that the number of seats held by a party in Parliament reflects the proportion of votes it received across the country

2647 (11.9%)

1127 (5.1%)

1483 (6.7%)

2764 (12.4%)

13147 (59.1%)

1082 (4.9%)

Figure 13: Number of seats held by a party in Parliament should reflect the proportion of votes it received across the country Scale: 1 (Strongly Disagree) – 5 (Strongly Agree); NA

Figure 13: Number of seats held by a party in Parliament should reflect  the proportion of votes it received across the country Scale: 1 (Strongly Disagree) – 5 (Strongly Agree); NA

Table 17: Independent candidates should be able to be elected to Parliament Scale: 1 (Strongly Disagree) – 5 (Strongly Agree); NA

Statement

Count and percent answers


1

2

3

4

5

NA

Independent candidates (not part of a political party) should be able to be elected to Parliament

1075 (4.8%)

692 (3.1%)

2101 (9.4%)

3792 (17.0%)

13420 (60.3%)

1168 (5.2%)

Figure 14: Independent candidates should be able to be elected to Parliament Scale: 1 (Strongly Disagree) – 5 (Strongly Agree); NA

Figure 14: Independent candidates should be able to be elected to Parliament Scale: 1 (Strongly Disagree) – 5 (Strongly Agree); NA

CURRENT ELECTORAL SYSTEM

Table 18: The current electoral system adequately reflects voters’ intentions Scale: 1 (Strongly Disagree) – 5 (Strongly Agree); NA

Statement

Count and percent answers


1

2

3

4

5

NA

The current electoral system adequately reflects voters' intentions

10075 (45.3%)

4416 (19.8%)

1796 (8.1%)

1594 (7.2%)

4093 (18.4%)

274 (1.2%)

Figure 15: The current electoral system adequately reflects voters’ intentions Scale: 1 (Strongly Disagree) – 5 (Strongly Agree); NA

Figure 15: The current electoral system adequately reflects voters’ intentions Scale: 1 (Strongly Disagree) – 5 (Strongly Agree); NA

Table 19: If I vote for a candidate in my riding who does not win, my vote is wasted Scale: 1 (Strongly Disagree) – 5 (Strongly Agree); NA

Statement

Count and percent answers


1

2

3

4

5

NA

If I vote for a candidate in my riding who does not win, my vote is wasted

6249 (28.1%)

2884 (13.0%)

2885 (13.0%)

3323 (14.9%)

6502 (29.2%)

405 (1.8%)

Figure 16: If I vote for a candidate in my riding who does not win, my vote is wasted Scale: 1 (Strongly Disagree) – 5 (Strongly Agree); NA

Figure 16: If I vote for a candidate in my riding who does not win,  my vote is wasted Scale: 1 (Strongly Disagree) – 5 (Strongly Agree); NA

Table 20: The current electoral system should be maintained Scale: 1 (Strongly Disagree) – 5 (Strongly Agree); NA

Statement

Count and percent answers


1

2

3

4

5

NA

The current electoral system should be maintained

12773 (57.4%)

2398 (10.8%)

979 (4.4%)

778 (3.5%)

4829 (21.7%)

491 (2.2%)

Figure 17: The current electoral system should be maintained Scale: 1 (Strongly Disagree) – 5 (Strongly Agree); NA

Figure 17: The current electoral system should be maintained Scale: 1 (Strongly Disagree) – 5 (Strongly Agree); NA

Table 21: The current electoral system should be changed Scale: 1 (Strongly Disagree) – 5 (Strongly Agree); NA

Statement

Count and percent answers


1

2

3

4

5

NA

The current electoral system should be changed

4599 (20.7%)

670 (3.0%)

623 (2.8%)

1842 (8.3%)

13793 (62.0%)

721 (3.2%)

Figure 18: The current electoral system should be changed Scale: 1 (Strongly Disagree) – 5 (Strongly Agree); NA

Figure 18: The current electoral system should be changed Scale: 1 (Strongly Disagree) – 5 (Strongly Agree); NA

PLURALITY OR MAJORITY SYSTEMS

Table 22: Seats in the House of Commons should be filled by the candidates who receive the most votes Scale: 1 (Strongly Disagree) – 5 (Strongly Agree); NA

Statement

Count and percent answers


1

2

3

4

5

NA

Seats in the House of Commons should be filled by the candidates who receive the most votes in their ridings even if they receive less than 50% of the total votes cast

7591 (34.1%)

3907 (17.6%)

2186 (9.8%)

1914 (8.6%)

5768 (25.9%)

881 (4.0%)

Figure 19: Seats in the House of Commons should be filled by the candidates who receive the most votes Scale: 1 (Strongly Disagree) – 5 (Strongly Agree); NA

Figure 19: Seats in the House of Commons should be filled by the candidates who receive the most votes Scale: 1 (Strongly Disagree) – 5 (Strongly Agree); NA

Table 23: In order be elected in a riding, a candidate should have to obtain more than half of the votes cast Scale: 1 (Strongly Disagree) – 5 (Strongly Agree); NA

Statement

Count and percent answers


1

2

3

4

5

NA

In order be elected in a riding, a candidate should have to obtain more than half of the votes cast

5421 (24.4%)

2142 (9.6%)

2957 (13.3%)

4791 (21.5%)

5861 (26.3%)

1076 (4.8%)

Figure 20: In order be elected in a riding, a candidate should have to obtain more than half of the votes cast Scale: 1 (Strongly Disagree) – 5 (Strongly Agree); NA

Figure 20: In order be elected in a riding, a candidate should have to obtain more than half of the votes cast Scale: 1 (Strongly Disagree) – 5 (Strongly Agree); NA

Table 24: Voters should be able to rank the candidates and have the outcome determined based on preferences Scale: 1 (Strongly Disagree) – 5 (Strongly Agree); NA

Statement

Count and percent answers


1

2

3

4

5

NA

For a candidate to obtain a majority of votes in one round of voting, voters should be able to rank candidates on the ballot and have the outcome determined based on a tally of preferences

6075 (27.3%)

1529 (6.9%)

2502 (11.2%)

4836 (21.7%)

6183 (27.8%)

1123 (5.0%)

Figure 21: Voters should be able to rank the candidates and have the outcome determined based on preferences Scale: 1 (Strongly Disagree) – 5 (Strongly Agree); NA

Figure 21: Voters should be able to rank the candidates and have the outcome determined based on preferences Scale: 1 (Strongly Disagree) – 5 (Strongly Agree); NA

Table 25: A second round should take place between the top two if no candidate obtains more than half the votes cast Scale: 1 (Strongly Disagree) – 5 (Strongly Agree); NA

Statement

Count and percent answers


1

2

3

4

5

NA

Alternatively, a second round of voting should take place between the top two candidates to determine the victor if no candidate obtains more than half the votes cast during a first round of voting

8561 (38.5%)

3111 (14.0%)

2820 (12.7%)

3083 (13.9%)

3445 (15.5%)

1228 (5.5%)

Figure 22: A second round should take place between the top two if no candidate obtains more than half the votes cast Scale: 1 (Strongly Disagree) – 5 (Strongly Agree); NA

Figure 22: A second round should take place between the top two if no candidate obtains more than half the votes cast Scale: 1 (Strongly Disagree) – 5 (Strongly Agree); NA

PROPORTIONAL REPRESENTATION SYSTEMS

Table 26: Voters should vote for political parties and the seats should be allocated based on percentage of votes Scale: 1 (Strongly Disagree) – 5 (Strongly Agree); NA

Statement

Count and percent answers


1

2

3

4

5

NA

Voters should vote for political parties (not specific candidates) and the seats should be allocated based on the percentage of votes obtained by each political party

8285 (37.2%)

3280 (14.7%)

3088 (13.9%)

3070 (13.8%)

3823 (17.2%)

703 (3.2%)

Figure 23: Voters should vote for political parties and the seats should be allocated based on percentage of votes Scale: 1 (Strongly Disagree) – 5 (Strongly Agree); NA

Figure 23: Voters should vote for political parties and the seats should be allocated based on percentage of votes  Scale: 1 (Strongly Disagree) – 5 (Strongly Agree); NA

Table 27: Political parties should determine which of their candidates get elected from their list Scale: 1 (Strongly Disagree) – 5 (Strongly Agree); NA

Statement

Count and percent answers


1

2

3

4

5

NA

Political parties should determine which of their candidates get elected from their list

11029 (49.6%)

4553 (20.5%)

3189 (14.3%)

1396 (6.3%)

1071 (4.8%)

1011 (4.5%)

Figure 24: Political parties should determine which of their candidates get elected from their list Scale: 1 (Strongly Disagree) – 5 (Strongly Agree); NA

Figure 24: Political parties should determine which of their candidates  get elected from their list Scale: 1 (Strongly Disagree) – 5 (Strongly Agree); NA

Table 28: Voters should determine which candidates get elected from a party’s list Scale: 1 (Strongly Disagree) – 5 (Strongly Agree); NA

Statement

Count and percent answers


1

2

3

4

5

NA

Voters should determine which candidates get elected from a party's list and the seats in the House of Commons should be allocated based on the percentage of votes obtained by each political party

4474 (20.1%)

1217 (5.5%)

2325 (10.4%)

4889 (22.0%)

8365 (37.6%)

979 (4.4%)

Figure 25: Voters should determine which candidates get elected from a party’s list Scale: 1 (Strongly Disagree) – 5 (Strongly Agree); NA

Figure 25: Voters should determine which candidates  get elected from a party’s list Scale: 1 (Strongly Disagree) – 5 (Strongly Agree); NA

Table 29: Canada’s electoral system should produce a proportional Parliament through the direct election of local representatives in multi-member districts Scale: 1 (Strongly Disagree) – 5 (Strongly Agree); NA

Statement

Count and percent answers


1

2

3

4

5

NA

Canada's electoral system should produce a proportional Parliament (where seats roughly match the parties' vote  share) through the direct election of local representatives in multi-member electoral districts

5357 (24.1%)

1472 (6.6%)

2386 (10.7%)

4461 (20.1%)

6973 (31.3%)

1600 (7.2%)

Figure 26: Canada’s electoral system should produce a proportional Parliament through the direct election of local representatives in multi-member districts Scale: 1 (Strongly Disagree) – 5 (Strongly Agree); NA

Figure 26: Canada’s electoral system should produce a proportional Parliament through the direct election of local representatives in multi-member districts Scale: 1 (Strongly Disagree) – 5 (Strongly Agree); NA

MIXED ELECTORAL SYSTEMS

Table 30: Voters should cast two votes on their ballots: one for a candidate and one for a party Scale: 1 (Strongly Disagree) – 5 (Strongly Agree); NA

Statement

Count and percent answers


1

2

3

4

5

NA

Voters should cast two votes on their ballots: one to directly elect a member to serve as their representative, and a second for a party or parties to fill seats in the House of Commons based on the vote share they receive

5986 (26.9%)

1784 (8.0%)

2722 (12.2%)

4142 (18.6%)

6372 (28.6%)

1243 (5.6%)

Figure 27: Voters should cast two votes on their ballots: one for a candidate and one for a party Scale: 1 (Strongly Disagree) – 5 (Strongly Agree); NA

Figure 27: Voters should cast two votes on their ballots: one for a candidate and one for a party Scale: 1 (Strongly Disagree) – 5 (Strongly Agree); NA

Table 31: Seats should be allocated in proportion to the percentage of votes received by each political party Scale: 1 (Strongly Disagree) – 5 (Strongly Agree); NA

Statement

Count and percent answers


1

2

3

4

5

NA

Seats in the House of Commons should be allocated in proportion to the percentage of votes received by each political party

4889 (22.0%)

1209 (5.4%)

1997 (9.0%)

3904 (17.5%)

9499 (42.7%)

751 (3.4%)

Figure 28: Seats should be allocated in proportion to the percentage of votes received by each political party Scale: 1 (Strongly Disagree) – 5 (Strongly Agree); NA

Figure 28: Seats should be allocated in proportion  to the percentage of votes received by each political party Scale: 1 (Strongly Disagree) – 5 (Strongly Agree); NA

MANDATORY OR COMPULSORY VOTING

Table 32: Canadians should be required to cast a ballot in a federal election Scale: 1 (Strongly Disagree) – 5 (Strongly Agree); NA

Statement

Count and percent answers


1

2

3

4

5

NA

Canadians should be required to cast a ballot in a federal election. (This could include spoiling a ballot.)

6231 (28.0%)

1846 (8.3%)

2137 (9.6%)

3144 (14.1%)

8064 (36.2%)

826 (3.7%)

Figure 29: Canadians should be required to cast a ballot in a federal election Scale: 1 (Strongly Disagree) – 5 (Strongly Agree); NA

Figure 29: Canadians should be required to cast a ballot in a federal election Scale: 1 (Strongly Disagree) – 5 (Strongly Agree); NA

Table 33: Canadians should be penalized for failing to cast a ballot in a federal election Scale: 1 (Strongly Disagree) – 5 (Strongly Agree); NA

Statement

Count and percent answers


1

2

3

4

5

NA

Canadians should be fined or receive some other penalty for failing to cast a ballot in a federal election without acceptable justification (e.g. illness, absence).

9564 (43.0%)

2628 (11.8%)

2544 (11.4%)

2171 (9.8%)

4361 (19.6%)

980 (4.4%)

Figure 30: Canadians should be penalized for failing to cast a ballot in a federal election Scale: 1 (Strongly Disagree) – 5 (Strongly Agree); NA

Figure 30: Canadians should be penalized for failing to  cast a ballot in a federal election Scale: 1 (Strongly Disagree) – 5 (Strongly Agree); NA

Table 34: Incentives should be put in place to encourage Canadians to cast a ballot Scale: 1 (Strongly Disagree) – 5 (Strongly Agree); NA

Statement

Count and percent answers


1

2

3

4

5

NA

Incentives should be put in place to encourage Canadians to cast a ballot in a federal election

5118 (23.0%)

1235 (5.6%)

2324 (10.4%)

3457 (15.5%)

9316 (41.9%)

798 (3.6%)

Figure 31: Incentives should be put in place to encourage Canadians to cast a ballot Scale: 1 (Strongly Disagree) – 5 (Strongly Agree); NA

Figure 31: Incentives should be put in place to encourage  Canadians to cast a ballot Scale: 1 (Strongly Disagree) – 5 (Strongly Agree); NA

ONLINE VOTING

Table 35: Canadians should be able to vote online in a federal election Scale: 1 (Strongly Disagree) – 5 (Strongly Agree); NA

Statement

Count and percent answers


1

2

3

4

5

NA

Canadians should be able to vote online in a federal election

5955 (26.8%)

1626 (7.3%)

2567 (11.5%)

3081 (13.8%)

7294 (32.8%)

1725 (7.8%)

Figure 32: Canadians should be able to vote online in a federal election Scale: 1 (Strongly Disagree) – 5 (Strongly Agree); NA

Figure 32: Canadians should be able to vote online in a federal election Scale: 1 (Strongly Disagree) – 5 (Strongly Agree); NA

Table 36: There is a public good or value associated with voting in person Scale: 1 (Strongly Disagree) – 5 (Strongly Agree); NA

Statement

Count and percent answers


1

2

3

4

5

NA

There is a public good or value associated with voting in person

2015 (9.1%)

1920 (8.6%)

3841 (17.3%)

4278 (19.2%)

9307 (41.8%)

887 (4.0%)

Figure 33: There is a public good or value associated with voting in person Scale: 1 (Strongly Disagree) – 5 (Strongly Agree); NA

Figure 33: There is a public good or value associated with voting in person Scale: 1 (Strongly Disagree) – 5 (Strongly Agree); NA

Table 37: I am concerned about the security and reliability of online voting Scale: 1 (Strongly Disagree) – 5 (Strongly Agree); NA

Statement

Count and percent answers


1

2

3

4

5

NA

I am concerned about the security and reliability of online voting

2298 (10.3%)

1812 (8.1%)

2464 (11.1%)

3936 (17.7%)

11369 (51.1%)

369 (1.7%)

Figure 34: I am concerned about the security and reliability of online voting Scale: 1 (Strongly Disagree) – 5 (Strongly Agree); NA

Figure 34: I am concerned about the security and reliability of online voting Scale: 1 (Strongly Disagree) – 5 (Strongly Agree); NA

Table 38: Online voting should only be considered as an alternative for people unable to vote in person on election day Scale: 1 (Strongly Disagree) – 5 (Strongly Agree); NA

Statement

Count and percent answers


1

2

3

4

5

NA

Online voting should only be considered as an alternative for people unable to vote in person on election day

5844 (26.3%)

2888 (13.0%)

3480 (15.6%)

3413 (15.3%)

5116 (23.0%)

1507 (6.8%)

Figure 35: Online voting should only be considered as an alternative for people unable to vote in person on election day Scale: 1 (Strongly Disagree) – 5 (Strongly Agree); NA

Figure 35: Online voting should only be considered as an alternative for people unable to vote in person on election day Scale: 1 (Strongly Disagree) – 5 (Strongly Agree); NA

MOVING FORWARD ON ELECTORAL SYSTEM REFORM

Table 39: Any plans for a future Canadian electoral system should be determined by a majority of members of Parliament Scale: 1 (Strongly Disagree) – 5 (Strongly Agree); NA

Statement

Count and percent answers


1

2

3

4

5

NA

Any plans for a future Canadian electoral system should be determined by a majority of members of Parliament

7540 (33.9%)

1991 (8.9%)

2862 (12.9%)

3507 (15.8%)

5551 (25.0%)

796 (3.6%)

Figure 36: Any plans for a future Canadian electoral system should be determined by a majority of members of Parliament Scale: 1 (Strongly Disagree) – 5 (Strongly Agree); NA

Figure 36: Any plans for a future Canadian electoral system should be determined by a majority of members of Parliament Scale: 1 (Strongly Disagree) – 5 (Strongly Agree); NA

Table 40: Any plans for a future Canadian electoral system should require broad public support Scale: 1 (Strongly Disagree) – 5 (Strongly Agree); NA

Statement

Count and percent answers


1

2

3

4

5

NA

Any plans for a future Canadian electoral system should require broad public support, in addition to parliamentary approval

1585 (7.1%)

1398 (6.3%)

2656 (11.9%)

3838 (17.3%)

12239 (55.0%)

531 (2.4%)

Figure 37: Any plans for a future Canadian electoral system should require broad public support Scale: 1 (Strongly Disagree) – 5 (Strongly Agree); NA

Figure 37: Any plans for a future Canadian electoral system should require  broad public support Scale: 1 (Strongly Disagree) – 5 (Strongly Agree); NA

Table 41: Broad public support should be gauged through in-person and online consultation Scale: 1 (Strongly Disagree) – 5 (Strongly Agree); NA

Statement

Count and percent answers

1

2

3

4

5

NA

Broad public support should be gauged through in-person and online consultation with Canadians representative of Canadian society (demographically and geographically)

4422 (19.9%)

1355 (6.1%)

3080 (13.8%)

5480 (24.6%)

7104 (31.9%)

806 (3.6%)

Figure 38: Broad public support should be gauged through in-person and online consultation Scale: 1 (Strongly Disagree) – 5 (Strongly Agree); NA

Figure 38: Broad public support should be gauged through in-person  and online consultation Scale: 1 (Strongly Disagree) – 5 (Strongly Agree); NA

Table 42: Broad public support should be gauged through the creation of a citizens’ assembly Scale: 1 (Strongly Disagree) – 5 (Strongly Agree); NA

Statement

Count and percent answers


1

2

3

4

5

NA

Broad public support should be gauged through the creation of a citizens' assembly. (A citizens' assembly is a body formed from a cross-section of the public, randomly selected and representative of Canadian society [demographically and geographically], to study the options available on an issue or issues of national importance.)

6173 (27.7%)

2642 (11.9%)

4204 (18.9%)

4240 (19.1%)

3844 (17.3%)

1144 (5.1%)

Figure 39: Broad public support should be gauged through the creation of a citizens’ assembly Scale: 1 (Strongly Disagree) – 5 (Strongly Agree); NA

Figure 39: Broad public support should be gauged through the creation  of a citizens’ assembly Scale: 1 (Strongly Disagree) – 5 (Strongly Agree); NA

Table 43: Broad public support should be gauged through a direct vote by Canadians Scale: 1 (Strongly Disagree) – 5 (Strongly Agree); NA

Statement

Count and percent answers


1

2

3

4

5

NA

Broad public support should be gauged through a direct vote by Canadians on an option or various options for a future Canadian electoral (through a plebiscite or referendum)

5566 (25.0%)

1896 (8.5%)

1814 (8.2%)

2413 (10.8%)

9776 (43.9%)

782 (3.5%)

Figure 40: Broad public support should be gauged through a direct vote by Canadians Scale: 1 (Strongly Disagree) – 5 (Strongly Agree); NA

Figure 40: Broad public support should be gauged through a direct vote by Canadians Scale: 1 (Strongly Disagree) – 5 (Strongly Agree); NA

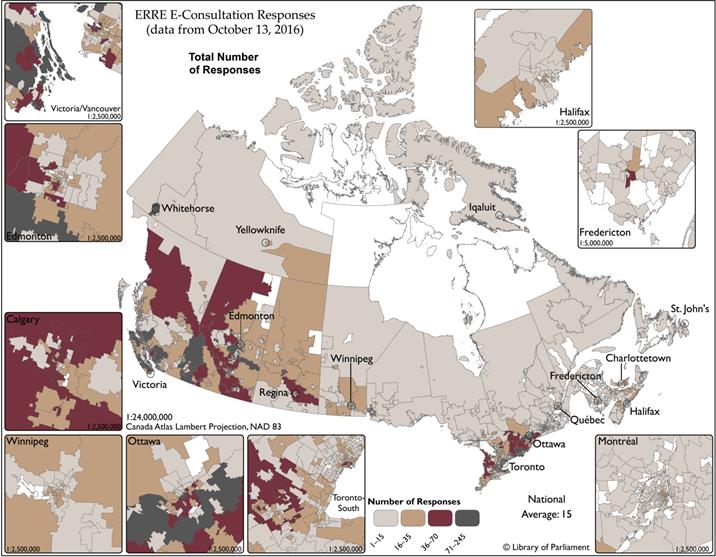
Distribution of E-Consultation Responses

ERRE E-Consultation Responses (data from October 2013, 2016)

Sources:    Map prepared by Library of Parliament using data from the House of Commons Special Committee on Electoral Reform.  E-Consultation on Electoral Reform.  Ottawa, October 2016; Natural Resources Canada.  Place Names.  In: Atlas of Canada National Scale Data 1:15,000,000 Series. Ottawa: Natural Resources Canada , 2014;  Statistics Canada.  Forward Sortation Area Boundary File, 2011 Census.  Ottawa:  Statistics Canada, 2013. The following software was used: Esri, ArcGIS, version 10.3.1. Contains information licensed under Open Government Licence – Canada.


[1] Statistics Canada, Population by year, by province and territory (Number), 28 September 2016. 

[2] Statistics Canada, Population by sex and age group, 28 September 2016. NB: Statistics Canada currently does not have a “transgendered” or “other/not specified” category.

[3] Statistics Canada, Population by sex and age group, 28 September 2016. NB: Statistics Canada has different age groupings than Elections Canada. Our survey was created based on Elections Canada groupings therefore the groupings from Statistics Canada do not exactly reflect the groupings in the our survey charts.

[4] Statistics Canada, Aboriginal Peoples in Canada: First Nations People, Métis and Inuit, based on 2011 National Household Survey.

[5] Statistics Canada, Disability in Canada: Initial findings from the Canadian Survey on Disability, 2012. The Canadian Survey on Disability uses the World Health Organization’s International Classification of Functioning, Disability and Health framework of disability. This framework defines disability as the relationship between body function and structure, daily activities and social participation, while recognizing the role of environmental factors. In keeping with this framework, the CSD targeted respondents who not only have a difficulty or impairment due to a long-term condition or health problem but also experience a limitation in their daily activities. The CSD definition of disability includes anyone who reported being “sometimes”, “often” or “always” limited in their daily activities due to a long-term condition or health problem, as well as anyone who reported being “rarely” limited if they were also unable to do certain tasks or could only do them with a lot of difficulty.

[6] Statistics Canada, Population, urban and rural, by province and territory, Statistics Canada defines “rural population” as “persons living outside centres with a population of 1,000 AND outside areas with 400 persons per square kilometre.”

[7] Office of the Chief Electoral Officer of Canada, Report on the 42nd General Election of October 19, 2015, 3 February 2016.