OGGO Committee Report
If you have any questions or comments regarding the accessibility of this publication, please contact us at accessible@parl.gc.ca.
SUPPLEMENTARY OPINION OF THE CONSERVATIVE PARTY OF CANADA: IGNORING THE LARGEST EMITTERS IS NOT A WHOLE OF GOVERNMENT APPROACH
The Operations and Government Estimates Committee (the Committee) study on the greening of government buildings had an opportunity – and failed – to build on the countless other studies being done by both House and Senate committees. In spite of repeated requests, the Committee was unable to hear from the Department of National Defence (DND) on their plans to decrease emissions, particularly given that DND accounts for the near majority of all government building emissions as noted in Figure 1.
Figure 1: Greenhouse gas emissions by federal organization in fiscal year 2017 to 2018 and the percentage change in emissions compared with fiscal year 2005-2006
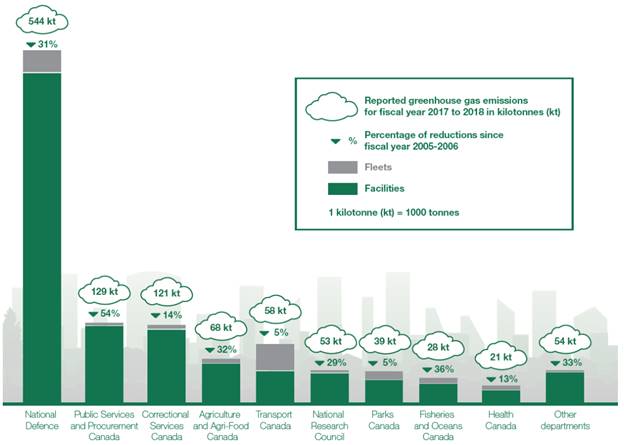
Source: Government of Canada’s Greenhouse Gas Emissions Inventory.
DND is by far the largest emitter in comparison to other federal departments with its total emissions accounting for 48% of all government greenhouse gas emissions. Despite interest in having DND appear to speak to why their facility emissions are so high, the Committee instead opted to look at areas that have already been studied at length by other committees. In this parliamentary session alone, there were three separate reports tabled by other committees on this exact subject.
In the context of this study, understanding the conditions that underpin the causes of emissions inefficiencies within DND would have been helpful in identifying which mechanisms within the current framework of greening policies are falling short. It would have also helped future governments in establishing a targeted program to assist DND in working within their own limitations and requirements to effectively decrease emissions. The Conservative Party is disappointed that the study, one of many currently being undertaken by Parliamentarians and Senators, failed to consider this key area of research and thus is of marginal value in helping the process of greening government.