HUMA Committee Report
If you have any questions or comments regarding the accessibility of this publication, please contact us at accessible@parl.gc.ca.
|
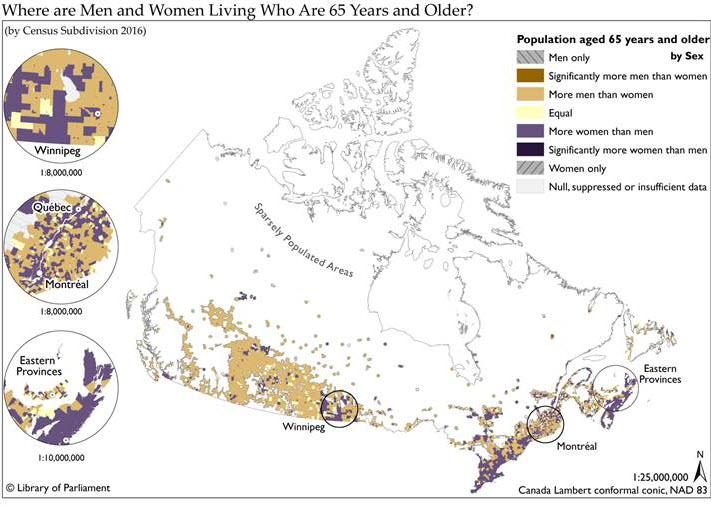
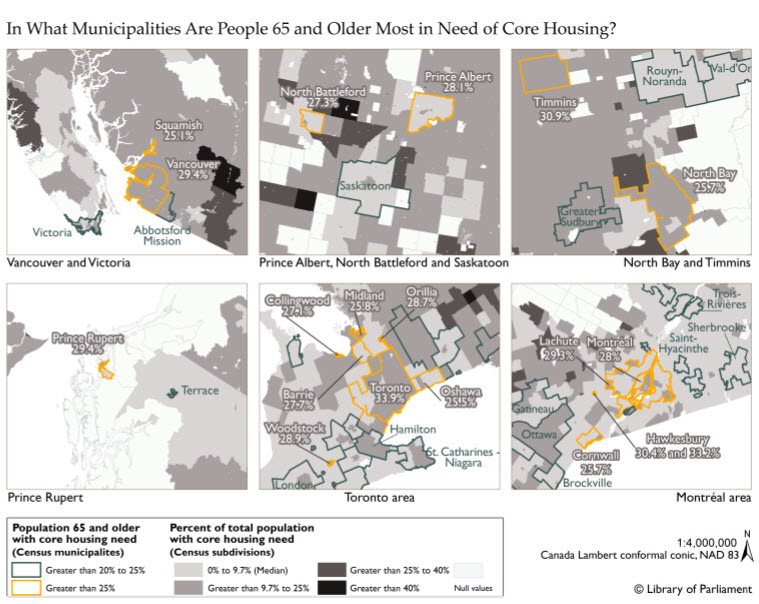
APPENDIX D: MAPS
Source: Map prepared by Library of Parliament, 2017, using data from Statistics Canada. 2016 Census of Canada. Census Profile Tables. Using CHASS (accessed November 2017); Statistics Canada. 2016 Census – Boundary files. Ottawa: Statistics Canada, 2016; Statistics Canada and Canada Mortgage and Housing Corporation, 2016 Census of Canada. Core Housing Need. Ottawa: Statistics Canada, 2016; and Statistics Canada, 2016 Census of Canada, Data Table: Housing, Catalogue no. 98-400-X2016234. The following software was used: Esri, ArcGIS, version 10.3.1. Contains information licensed under Statistics Canada Open Licence Agreement. |